검색 결과

EUR/USD outlook: The dollar’s rate-cut reckoning
What began as a quiet Thanksgiving week has turned into the dollar’s steepest weekly decline in four months.
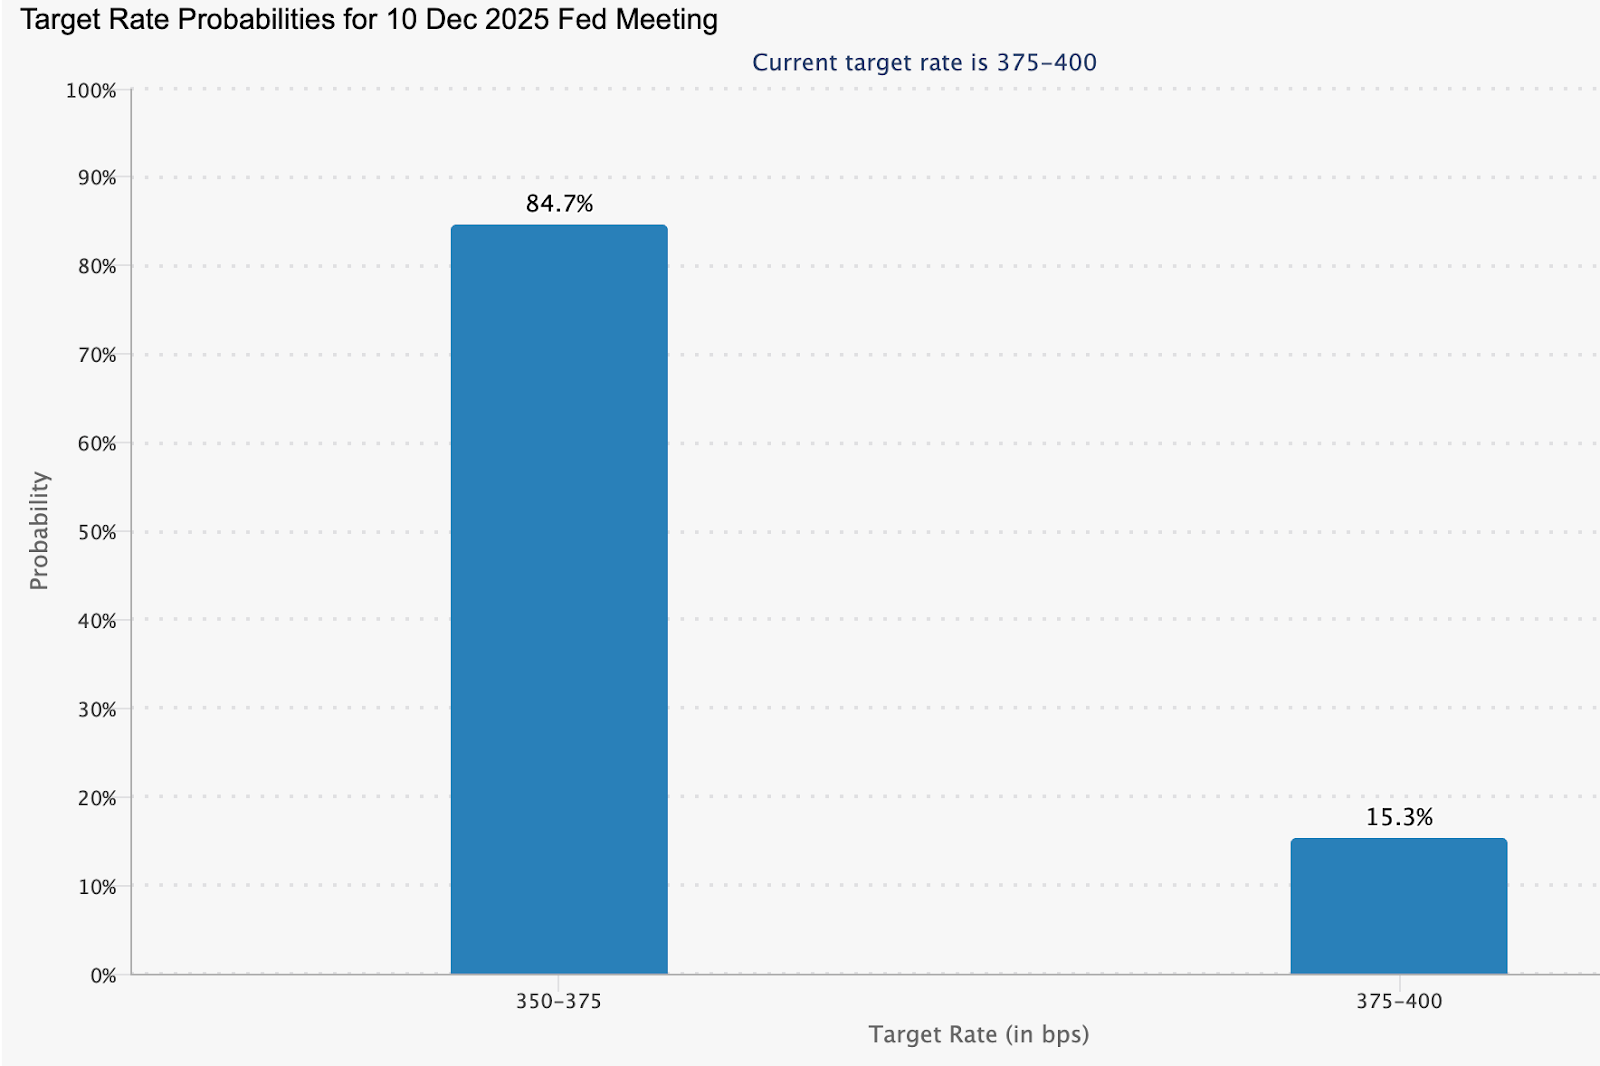
According to reports, the dollar’s rate-cut reckoning is now the defining force in EUR/USD, with traders pushing expectations for a December Federal Reserve cut to more than 85%, up sharply from 39% just a week earlier. What began as a quiet Thanksgiving week has turned into the dollar’s steepest weekly decline in four months, reshaping the balance of power across major currency pairs.
EUR/USD is rising not because the euro has rediscovered its strength, but because the dollar is losing the policy advantage it has enjoyed for most of the year. As markets confront the prospect of a softer Fed and political pressure on the institution intensifies, the pair is becoming a barometer for how much credibility the central bank is willing to risk in the months ahead.
What’s driving EUR/USD right now?
The Fed sits squarely at the centre of the story. Rate expectations have shifted at a pace not seen since early summer, with futures markets now assuming a December cut as the most likely outcome. Reuters reported a series of softer labour market indicators, dovish public remarks from key policymakers, and increased speculation around Kevin Hassett’s potential nomination as the next Fed Chair have accelerated the move. Thin U.S. liquidity over the Thanksgiving holiday added fuel, allowing even modest data points to push the dollar lower.
This recalibration has allowed EUR/USD to climb despite Europe’s mixed economic backdrop. The dollar index, still hovering near 99.72, is heading for its worst weekly performance since late July.

The euro briefly touched a 1½-week high of $1.1613 before easing, supported more by dollar fatigue than by renewed optimism in the eurozone. Even so, the narrowing of U.S.–European rate differentials has created space for euro bulls to test higher levels, something that looked unlikely just two weeks ago.
Why the dollar is facing its own reckoning
Political pressure is becoming an increasingly prominent part of the narrative. President Donald Trump has renewed calls for deeper rate cuts, arguing that the Fed must “move quickly” to support economic momentum.
The possibility that Kevin Hassett - a prominent advocate of looser policy - could become the next Fed Chair has forced traders to reassess the institution’s independence and long-term trajectory. Markets are now questioning whether December’s cut is simply another precaution or the start of a strategically driven easing cycle.
At the macro level, the dollar’s credibility premium is also being tested. Barclays’ global head of FX strategy, Themos Fiotakis, argued that Europe had benefited in recent months from supportive rate differentials and improving sentiment, but warned that these assumptions are now under reassessment. The euro’s valuation remains high by several metrics, while the U.S. economy continues to show pockets of resilience, particularly in services. The dollar’s decline, therefore, reflects less a loss of faith and more a repricing of what the next policymaking regime might look like.
What this means for EUR/USD traders
Positioning in EUR/USD has turned decisively constructive, according to analysts. With holiday-thinned liquidity amplifying moves, traders have been quick to unwind long-USD positions accumulated during the autumn rally. The shift has also been visible in cross-asset markets: U.S. 10-year Treasury yields briefly dipped below 4% before rebounding, while German bunds held steady, creating a more supportive environment for the euro.

For corporates, the recalibration matters. European exporters face a marginally stronger currency, which could tighten their margins if the trend persists, while importers benefit from reduced dollar-denominated costs. For investors, the EUR/USD is becoming a call on relative credibility: whether the Fed’s pivot is justified by economic factors or shaped by politics - and whether the European Central Bank can maintain stability as global conditions change.
The geopolitical backdrop adds another layer, analysts added. Markets are tracking every incremental update on Ukraine peace negotiations, with Vladimir Putin signalling that draft proposals could form the basis of future talks. While analysts caution against expecting a rapid “peace premium”, even the possibility of de-escalation has helped cap dollar demand against the euro.
Expert outlook
In the near term, market watchers stated the EUR/USD will remain closely tied to U.S. policy signals. A confirmed December rate cut, reinforced by dovish messaging, could send the pair back toward 1.17. But any upside surprise in U.S. labour or inflation data would temper enthusiasm and reintroduce volatility, particularly for leveraged positions - something traders often evaluate beforehand using the Deriv trading calculator to manage risk.
Medium-term dynamics remain more uncertain. The eurozone continues to wrestle with uneven growth and limited fiscal momentum, which could limit the sustainability of any rally built solely on dollar weakness. At the same time, bond markets remain a crucial indicator: if the U.S. 10-year yield breaks back above 4.1%, the dollar could regain some cyclically driven strength, according to experts.
The next trigger may come from a combination of Fed rhetoric, incoming U.S. data, and developments in Eastern Europe, all of which have the potential to redirect EUR/USD in the weeks ahead.
EUR/USD technical insights
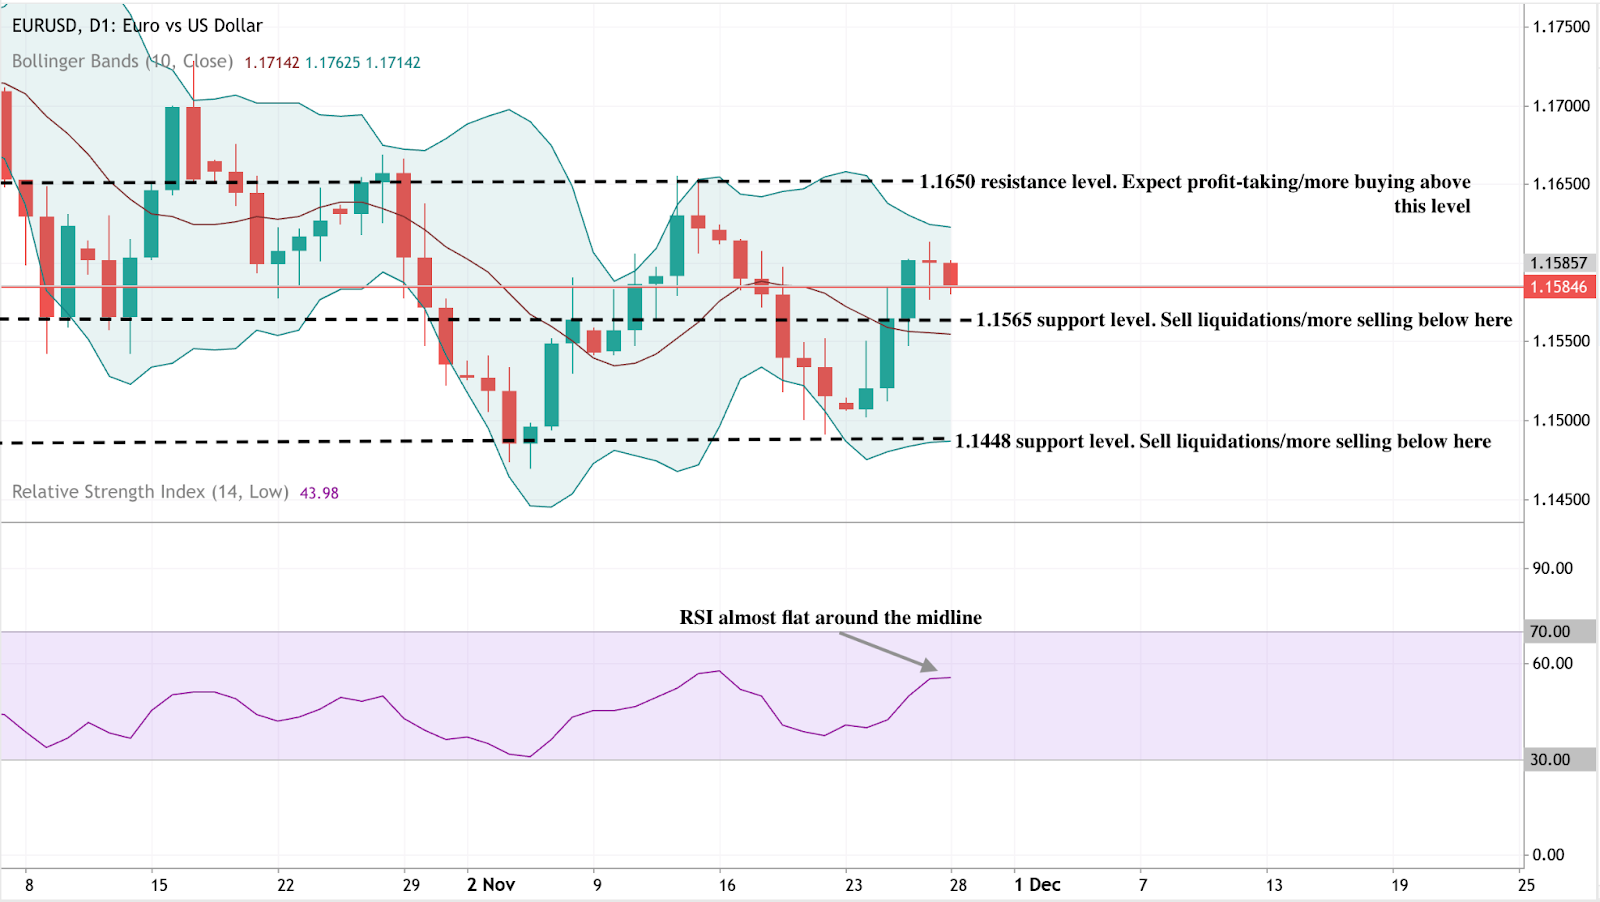
At the start of writing, EUR/USD is trading near 1.1585, moving sideways within a well-defined range. The pair continues to face overhead pressure from the 1.1650 resistance level, where traders may look for profit-taking or renewed buying if the price can break convincingly above it. On the downside, the first key support level sits at 1.1565, followed by a stronger base at 1.1448. A break below either level is likely to trigger sell liquidations and deeper downside momentum.
The price remains contained within the Bollinger Bands, indicating a market lacking strong directional conviction. This consolidative structure suggests EUR/USD may continue chopping within the range unless a macro catalyst - such as ECB or Fed commentary - forces a breakout.
The RSI is nearly flat, sitting around 44, close to the midline and signalling neutral momentum. Neither bulls nor bears currently dominate, reinforcing the idea that the pair is in a holding pattern while awaiting its next decisive move.
Key takeaway
EUR/USD is climbing because the dollar is undergoing a policy reckoning shaped by rapid shifts in rate expectations and rising political influence. The euro may not have a strong domestic story, but the repricing of U.S. monetary credibility has given it new momentum. The next leg depends on the Fed's decision in December, U.S. Treasury yields, and geopolitical developments. Traders on Deriv MT5 will closely watch those catalysts as they adjust their strategies.

은이 조용히 금을 능가하다: 상승세가 계속될 수 있을까?
최근 데이터에 따르면 은은 이번 주 7% 이상 상승하며 기록적인 고점에 근접했습니다.
은이 조용히 금을 능가하고 있습니다 - 하지만 이 상승세가 계속될 수 있을까요? 최근 데이터는 이 금속이 이번 주 7% 이상 상승하며 XAG/USD를 기록적인 고점에 근접시켰는데, 이는 얇은 추수감사절 유동성이 모든 움직임을 확대했기 때문입니다. 보통 주목받는 금은 변동성이 줄어든 반면, 은은 계절적이지 않은 급등으로 주목받고 있습니다.
시장 관측자들은 이번 돌파의 배경이 현실적이라고 평가합니다: 약한 미국 소매 판매, 무너지는 소비자 기대감, 그리고 12월 Fed 금리 인하 가능성이 84%에 달하면서 안전자산 수요가 급증했습니다. 트레이더들은 이번 급등이 일시적인 휴일 변동성인지, 아니면 구조적 재평가의 초기 단계인지를 저울질하고 있습니다. 이 질문 - 은의 초과 성과가 지속될 수 있을지 여부 - 가 나머지 시장 분석의 분위기를 결정합니다.
은 급등의 원인은?
은의 최근 랠리는 거시적 스트레스와 유동성 감소가 교차하는 지점에 있습니다. 미국 소매 판매는 2021년 이후 명목상 증가했으나, 소비자 엔진이 정체되어 성장 여지가 거의 없음을 시사합니다. 컨퍼런스 보드의 기대 지수는 63.2로 급락했는데, 이는 역사적으로 경기 침체를 예고하는 수준으로, 방어적 자산으로의 급격한 이동을 강화합니다.

투자자들이 미국 수요 경로를 재평가함에 따라 경제 변화에 민감한 금속들이 가장 빠르게 반응했으며, 그중 은이 가장 두드러졌습니다.
연방준비제도의 정책 전환이 이 변화를 가속화했습니다. 시장은 금리 인하 확률을 며칠 만에 50%에서 84%로 급격히 재평가했습니다.
뉴욕 연준 총재 John Williams와 다른 관계자들의 발언은 모멘텀이 계속 약화될 경우 완화 준비가 되어 있음을 시사했습니다. 국채 수익률이 한 달 최저치로 후퇴하고 달러가 약세를 보이면서, 수익률이 없는 자산들이 큰 이점을 누리고 있습니다. 은이 이러한 조건에 민감하게 반응하는 이유가 바로 이 때문이며, 그 움직임이 즉각적이고 극적이었던 배경을 설명합니다.
중요한 이유
분석가들에 따르면 은의 상승은 단순히 랠리 속도 때문만이 아니라 그 반영하는 바 때문입니다. 금이 궁극의 안전자산으로 명성을 얻었음에도 불구하고, 은은 2023년 10월 이후 163% 상승하며 이달 초 사상 최고가인 54.38달러를 기록하며 금을 크게 앞섰습니다. 은은 통화 헤지와 산업적 용도의 교차점에 위치해 있어 기관들이 무시하기 점점 어려워지고 있습니다.
또한 이 가격 움직임은 더 깊은 불안을 드러내고 있다고 경고합니다. KCM Trade의 수석 시장 분석가 Tim Waterer는 시장이 “비둘기파적 발언의 합창”에 반응하고 있으며, 약한 거시 지표가 쌓이고 있다고 지적합니다. 그의 평가는 더 넓은 문제를 가리키는데, 은이 강한 성장 때문이 아니라 미국 경제의 향방에 대한 신뢰가 약화되고 있기 때문에 랠리 중이라는 것입니다. 금속들은 그 불확실성을 실시간으로 흡수하고 있습니다.
시장 및 산업에 미치는 영향
트레이더들에게 은의 급등은 휴일 기간 시장이 얇아지면서 포지셔닝을 복잡하게 만듭니다. 참여가 줄어들면 일중 변동성이 확대되어 방향성 위험을 헤지하기가 더 어려워집니다. Deriv MT5와 같은 플랫폼에서는 변동성 높은 상황에서 실행 속도와 정확한 거래 규모가 중요하기 때문에, 이 환경에서 트레이더들은 경계를 늦출 수 없습니다. 많은 이들이 Deriv 거래 계산기와 같은 도구를 활용해 은의 급격한 일중 변동 전에 잠재 수익, 스왑 비용, 포지션 노출을 측정하고 있습니다.
하지만 더 깊은 이야기는 산업 부문에 있습니다. 2024년 태양광 패널 제조용 은 수요는 2억 4,370만 온스로 2023년의 1억 9,180만 온스에서 크게 증가했으며, 2020년 수준의 두 배 이상입니다.
전 세계 태양광 용량이 2030년까지 연간 거의 1,000GW에 이를 것으로 예상되면서 수요는 연간 1억 5,000만 온스 이상 추가로 증가할 전망입니다. 그러나 공급은 제한적입니다: 전 세계 은 생산의 대부분은 구리, 아연, 납 또는 금 생산의 부산물로, 가격 신호에 빠르게 대응하기 어렵습니다. Mining Technology는 2030년까지 전 세계 생산량이 9억 100만 온스로 감소할 수 있다고 추정하며, 이는 장기적으로 가격 상승을 뒷받침하는 구조적 적자입니다.
전문가 전망
전문 트레이더들은 은의 상승 지속 가능성이 세 가지 핵심 요인에 달려 있다고 말합니다: Fed의 다음 조치, 미국 소비의 향방, 그리고 산업 확장의 속도입니다. 정책 입안자들이 12월 전환을 확인하면, 낮은 수익률과 약한 달러의 조합이 가격을 새로운 기록권으로 끌어올릴 촉매제가 될 수 있습니다. 경기 침체 신호가 더욱 뚜렷해지면서 안전자산 수요가 빠르게 사라질 가능성은 낮습니다.
하지만 확실한 것은 없습니다. 소비 활동의 갑작스러운 반등이나 인플레이션 충격은 정책 완화 기대를 늦출 수 있습니다. 산업 사용자들은 결국 높은 가격에 반발할 수 있지만, 태양광 수요는 단기 변동성을 흡수할 만큼 견고해 보입니다. 현재로서는 트레이더들이 들어오는 거시경제 데이터와 Federal Reserve의 소통을 면밀히 주시하고 있습니다. 이전 고점을 결정적으로 돌파하면 시장이 은에 대해 근본적으로 새로운 가격 체제를 보고 있음을 알리는 신호가 될 수 있습니다.
핵심 요점
은의 급등은 약화하는 미국 데이터와 단기 금리 인하 기대 상승 등 실제 경제 신호에 뿌리를 두고 있습니다. 이 금속은 금을 능가하며 역사적 고점에 근접해 있으며, 안전자산 흐름과 강력한 산업적 배경에 의해 지지받고 있습니다. 상승세가 계속될지는 Fed의 메시지와 미국 가계의 회복력에 달려 있지만, 전반적인 추세는 공급 긴축과 지속적인 수요를 가리킵니다. 앞으로 몇 주가 은이 단순한 랠리를 하는지, 아니면 완전히 새로운 사이클로 재평가되는지를 보여줄 것입니다.
은 기술적 인사이트
작성 시점에 은(XAG/USD)은 약 53.79달러에서 거래되며 주요 저항선인 54.22달러에 근접하면서 공격적으로 상승하고 있습니다. 이 구간에서는 차익 실현이 예상되지만, 현재 랠리의 강도를 감안할 때 깔끔한 돌파가 새로운 모멘텀 매수를 촉발할 수 있습니다.
하락 측면에서는 50.00달러와 47.00달러가 주요 지지선입니다. 이 중 어느 하나 아래로 하락하면 강세 압력이 약화되었음을 나타내며, 특히 가격이 Bollinger Band 채널 중간선을 하락 돌파할 경우 매도 청산이나 더 깊은 조정이 촉발될 수 있습니다.
모멘텀은 여전히 강하며, RSI는 약 80까지 급격히 상승해 과매수 구간에 확실히 진입했습니다. 이는 매수세가 우세함을 나타내지만 단기 피로 가능성도 경고합니다. 상승 추세는 유지되고 있으나, 과매수 상태가 지속되면 은은 조정이나 횡보에 취약할 수 있습니다.


비트코인의 구원 여정: 9만 달러 돌파가 정말 유지될 수 있을까?
비트코인이 9만 달러를 넘어 다시 상승하면서 구원 여정이 본격화되었고, 이 돌파가 진정으로 유지될 수 있을지 의문이 제기되고 있다.
세계 최대 암호화폐인 비트코인이 9만 달러를 넘어 다시 상승하면서 비트코인의 구원 여정이 본격화되었고, 이 돌파가 진정으로 유지될 수 있을지 의문이 제기되고 있다. 이 움직임은 며칠 전 약 8만 400달러 저점에서 급반등한 데 따른 것으로, 주로 12월에 연방준비제도(Fed)가 금리를 인하할 것이라는 기대감과 위험자산으로의 광범위한 전환에 힘입은 것으로 알려졌다.
그러나 비트코인의 랠리는 아직 불안정한 상태에 있으며, 현물 ETF는 여전히 유입이 약하고 월간 성과는 BTC가 거의 19% 하락한 상태로, 반등의 기반이 고르지 않음을 보여준다.
분석가들은 이러한 낙관론과 유동성 악화 간의 긴장이 현재 시장 분위기를 정의한다고 평가한다. 비트코인이 이번 회복을 지속 가능한 것으로 전환하려면 9만 2천 달러에서 9만 5천 달러 구간의 강한 저항을 극복하고 소매 거래량과 ETF 참여의 결정적인 회복을 이끌어내야 한다. 이러한 조건이 나타날지, 아니면 돌파가 또 다른 조정 하락으로 사라질지가 비트코인의 이른바 구원 여정의 다음 장을 결정할 것이다.
비트코인의 최근 움직임을 이끄는 요인
비트코인의 최근 상승은 부분적으로 거시경제 기대 변화에 힘입은 바 크다. 트레이더들은 이제 12월 연방준비제도 금리 인하 가능성을 더 높게 평가하며, 이는 주식 및 암호화폐 시장 전반의 위험 선호 회복을 촉진하고 있다.
이러한 심리 변화는 BTC가 지난주 8만 달러 지역까지 하락한 후 9만 달러 선을 회복하는 데 도움을 주었다. 그러나 배경은 더 복잡하다. 인플레이션이 여전히 높게 유지되고 있어 QCP Capital의 분석가들은 “공급이 BTC를 9만 중반 달러대에서 제한할 가능성이 높다”고 경고하며 랠리가 곧 소진될 수 있음을 시사한다.
ETF 환경도 또 다른 층을 더한다. 수주간 기록적인 자금 유출 이후 미국 비트코인 ETF는 꾸준한 자금 유입을 끌어내는 데 어려움을 겪고 있다. 분석가들은 유동성이 여전히 얇고 투자자 수요가 주저하고 있다고 지적한다.
비트코인의 최대 기업 보유자 중 하나인 MicroStrategy는 이제 막 손익분기점에 근접했으며 MSCI의 상장폐지 감시 목록에 올라 기관 노출에 대한 불확실성을 증폭시키고 있다. 이러한 스트레스는 가격이 회복되는 동안에도 표면 아래에 남아 있어, 강한 자본 유입보다는 거시경제적 포지셔닝에 기반한 랠리임을 드러낸다.
중요한 이유
가격 움직임과 구조적 지표 간의 괴리는 투자자들의 주요 관심사가 되었다. Apollo의 수석 이코노미스트 토르스텐 슬록은 비트코인의 나스닥과의 전형적인 상관관계가 최근 몇 주간 약화되었으며, BTC가 주요 기술 지수보다 더 빠르게 하락했다고 지적한다.

이러한 분리는 주식시장이 안정되는 시점에 암호화폐 특유의 유동성 문제에 대한 의문을 제기한다. 한편 10X Research의 분석가들은 시장이 12월 금리 인하에 너무 큰 기대를 걸고 있을 수 있다고 경고한다. 그들의 연구는 비트코인이 실제 정책 움직임보다는 Fed의 커뮤니케이션과 어조에 더 민감하게 반응한다고 제시한다.
파월 의장이 신중한 태도를 보이거나 향후 완화 속도를 축소한다면 시장은 빠르게 반전할 수 있다. 이 회사는 또한 재무부 일반계정(TGA) 지출이 암호화폐 유동성의 촉매라는 가정에 의문을 제기하며, 이전 TGA 자금 방출이 비트코인 가격에 반영되기까지 최대 두 달이 걸렸거나 아예 반영되지 않았다고 지적한다.
산업, 시장 및 소비자에 미치는 영향
최근 데이터에 따르면 비트코인이 9만 달러를 넘어선 움직임은 심리적 신뢰를 일부 회복시켰을 수 있으나 구조적 상황은 여전히 불균형하다. 자산은 연초 대비 여전히 5% 하락했으며, ETF 상품은 BTC가 약 8만 달러까지 하락하는 데 기여한 대규모 자금 유출 이후에야 최근에야 안정화되었다. 반등은 안도감을 제공했지만 시장은 아직 명확한 상승 추세를 시사하지 않는다.
기관 자금 흐름은 변화를 암시한다. VALR CEO 파잠 에사니는 현물 ETF가 수주 만에 처음으로 화요일에 자금 유입을 보였으며, 이는 “기관 유동성이 돌아오고 있다는 초기 신호”라고 말했다. Deriv MT5를 통해 가격 움직임을 모니터링하는 트레이더들은 9만 달러가 구조적 전환점으로 중요하다고 언급하며, 단기 차트에서는 강세 시도와 이익 실현 물결 사이의 변동성이 관찰된다. 한편 Deriv 거래 계산기는 BTC가 주요 저항선과 맞서면서 포지션 비용과 위험을 추정하려는 트레이더들에게 점점 더 유용해지고 있다.
시장 관측자들에 따르면 비트코인의 성과는 광범위한 디지털 자산 복합체에 계속 영향을 미친다. 9만 달러 이상을 확실히 유지하면 알트코인 및 스테이블코인 시장 전반에 유동성을 촉진할 수 있다. 위험이 무너지면 강제 매도가 재개되고 섹터 전반의 신뢰가 약화될 수 있다.
전문가 전망
QCP Capital은 9만 2천 달러에서 9만 5천 달러 사이에 명확한 저항대가 형성되고 있으며, 유동성 감소가 상승 시도를 제한할 수 있다고 경고한다. 그들은 최근 매도세 동안 매수자들이 방어한 8만 달러~8만 2천 달러 구간을 중요한 지지 영역으로 식별한다. 10X Research의 분석가들은 과거 TGA 유동성 지연이 지속된다면 비트코인이 2026년 1월 말까지 횡보할 수 있어 빠른 돌파 가능성이 낮아진다고 덧붙인다.
모든 전략가가 바닥에 도달했다고 믿는 것은 아니다. Compass Point의 분석가 에드 엥겔은 약세장이 종종 “빠른 안도 랠리 후 강한 매도세가 뒤따른다”고 주장한다. 그는 장기 보유자의 순매수와 선물 시장에서의 보다 적극적인 숏 포지션이 나타나기 전까지는 긍정적 전망을 내놓지 않는다. 이러한 신호가 없으면 엥겔은 BTC가 9만 2천 달러~9만 5천 달러에 접근할 때 강한 저항에 부딪혀 다시 하락세로 전환될 위험이 있다고 본다.
핵심 요점
분석가들은 비트코인이 9만 달러를 넘어선 상승이 구원 여정의 상징적 전환점임을 지적하지만, 이번 랠리의 기반은 여전히 약하다고 평가한다. 9만 2천 달러~9만 5천 달러 부근의 저항, 약한 ETF 자금 유입, 그리고 역사적으로 취약한 연말 유동성 환경이 돌파의 지속 가능성에 도전 과제를 제기한다.
다음 단계는 시장이 Fed의 12월 메시지를 어떻게 소화하는지, 소매 거래자들이 돌아오는지, 기관 자금 유입이 강화되는지에 달려 있다. 이러한 요인들이 비트코인의 부활이 계속될지, 아니면 익숙한 저항선에서 멈출지를 결정할 것이다.
비트코인 기술적 인사이트
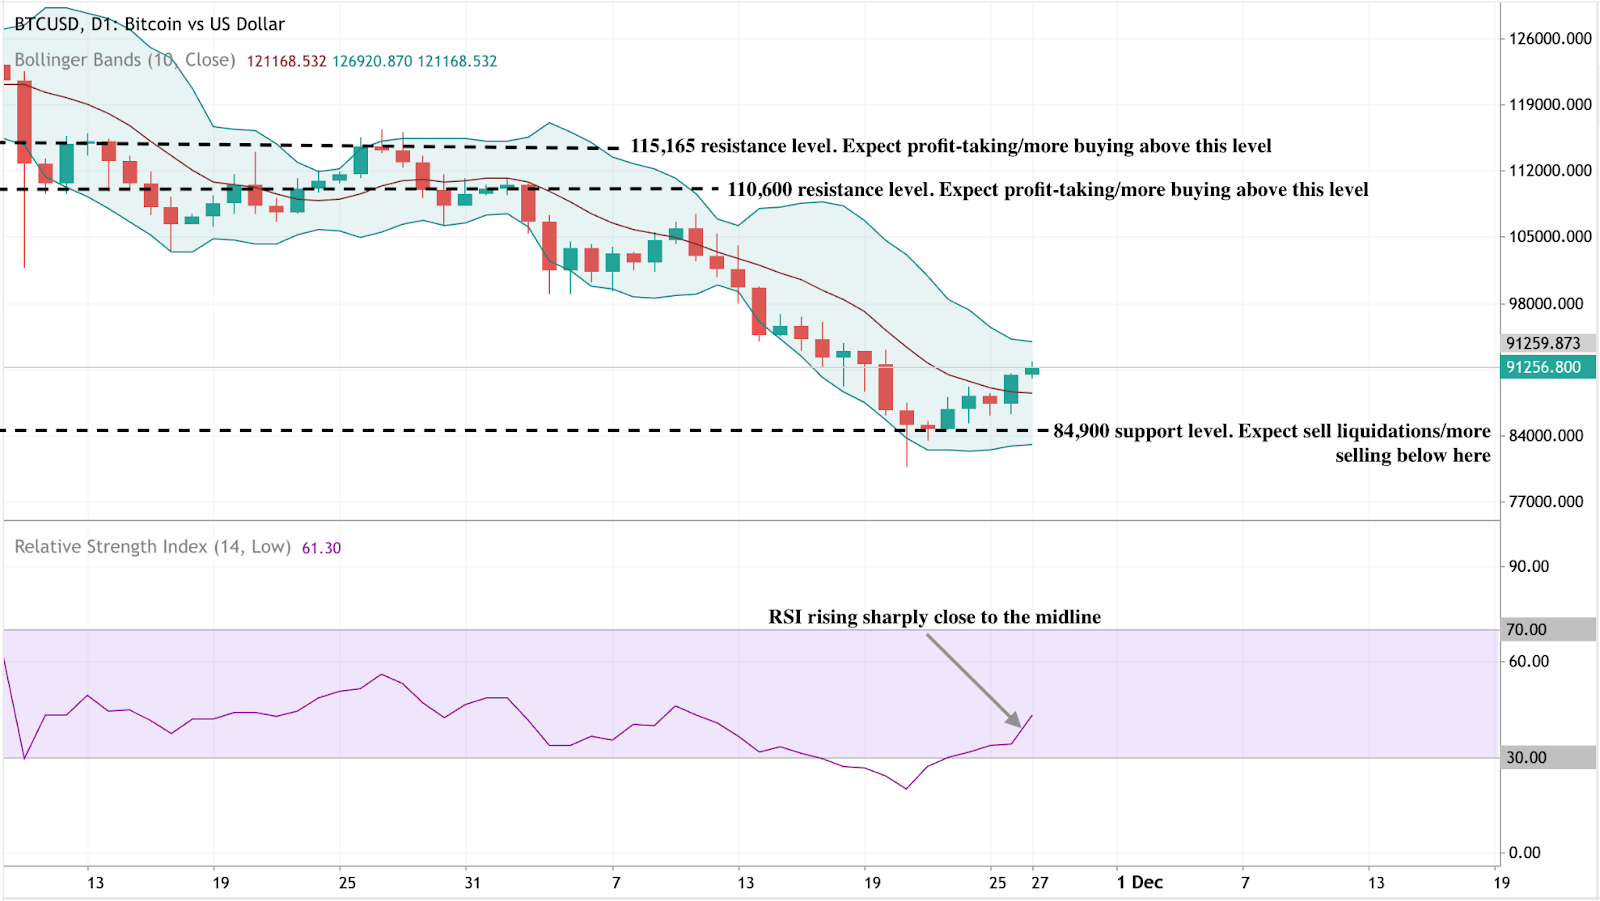
작성 시점에서 비트코인(BTC/USD)은 최근 저점에서 회복을 시도하며 주요 지지선인 8만 4,900달러 구간에서 반등한 후 9만 1,200달러 선 바로 위에서 거래되고 있다. 이 수준을 유지하는 것이 중요하며, 이 아래로 하락하면 매도 청산이 촉발되어 하락 추세가 재개될 수 있다. 반면 상승 측면에서는 BTC가 이제 두 개의 중요한 저항선인 11만 600달러와 11만 5,165달러에 직면해 있으며, 가격이 충분한 모멘텀을 쌓아 이들을 재시험할 경우 트레이더들은 이익 실현이나 매수 재개를 모색할 수 있다.
가격 움직임은 볼린저 밴드 내에 머물러 있으며, BTC는 장기간 약세 후 중간 밴드를 향해 밀고 있다. 이는 안정화의 초기 신호를 시사하지만, 저항 구간을 명확히 돌파하기 전까지는 전반적인 추세가 여전히 신중한 상태임을 나타낸다.
RSI는 약 61까지 급격히 상승하며 과매도 상태에서 중간선으로 다시 올라왔다. 이 변화는 강세 모멘텀의 개선을 강조하지만, 과매수 수준에 도달하기 전까지 여유가 많아 매수세가 계속된다면 회복 여력이 더 있을 수 있음을 시사한다.

BoJ vs Fed: How December decisions could shatter the yen’s fragile range
A potential BoJ rate hike clashing against near-certain Fed easing could finally tip the scales
December 2025 is poised to deliver a high-stakes policy showdown between the Bank of Japan (BoJ) and the US Federal Reserve, with USD/JPY hovering in a precarious 154–158 band, suggesting intervention is likely.
As of 27 November 2025, the pair trades around 155.91, down slightly from recent highs near 157.89 but still vulnerable to a break in either direction. A potential BoJ rate hike clashing against near-certain Fed easing could finally tip the scales - yen bulls are banking on a downside rupture, while bears eye a dollar rebound if either central bank disappoints.
The yen’s tightrope: USD/JPY’s November range
USD/JPY has been confined between the 154.00 support price and 158.00 danger zone price through much of November, a tug-of-war between persistent US yield strength propping up the dollar and mounting speculation on policy divergence.
The upper end-157-158-marks familiar "intervention territory," where Tokyo has deployed verbal and actual yen support in past episodes of rapid depreciation. This range persists amid a backdrop of weak yen-fueled inflation risks in Japan and cooling US data, which is tilting toward Fed cuts.
BoJ: A December hike edges into focus
BoJ rhetoric has sharpened on yen weakness as an inflation accelerant, with import costs now a key concern. A Reuters poll from 11-18 November revealed a slim majority - 53% (43 of 81 economists) - anticipating a 25 basis point hike to 0.75% at the 18-19 December meeting, up from prior surveys. All polled forecasters see at least that level by March 2026.
Easing political friction has helped: Prime Minister Sanae Takaichi’s recent nod to gradual normalisation, following talks with Governor Kazuo Ueda, has reduced near-term hurdles. Ex-BoJ insiders echo this, citing current levels as a catalyst for action sooner than later.
Fed: Overwhelming odds on a December cut
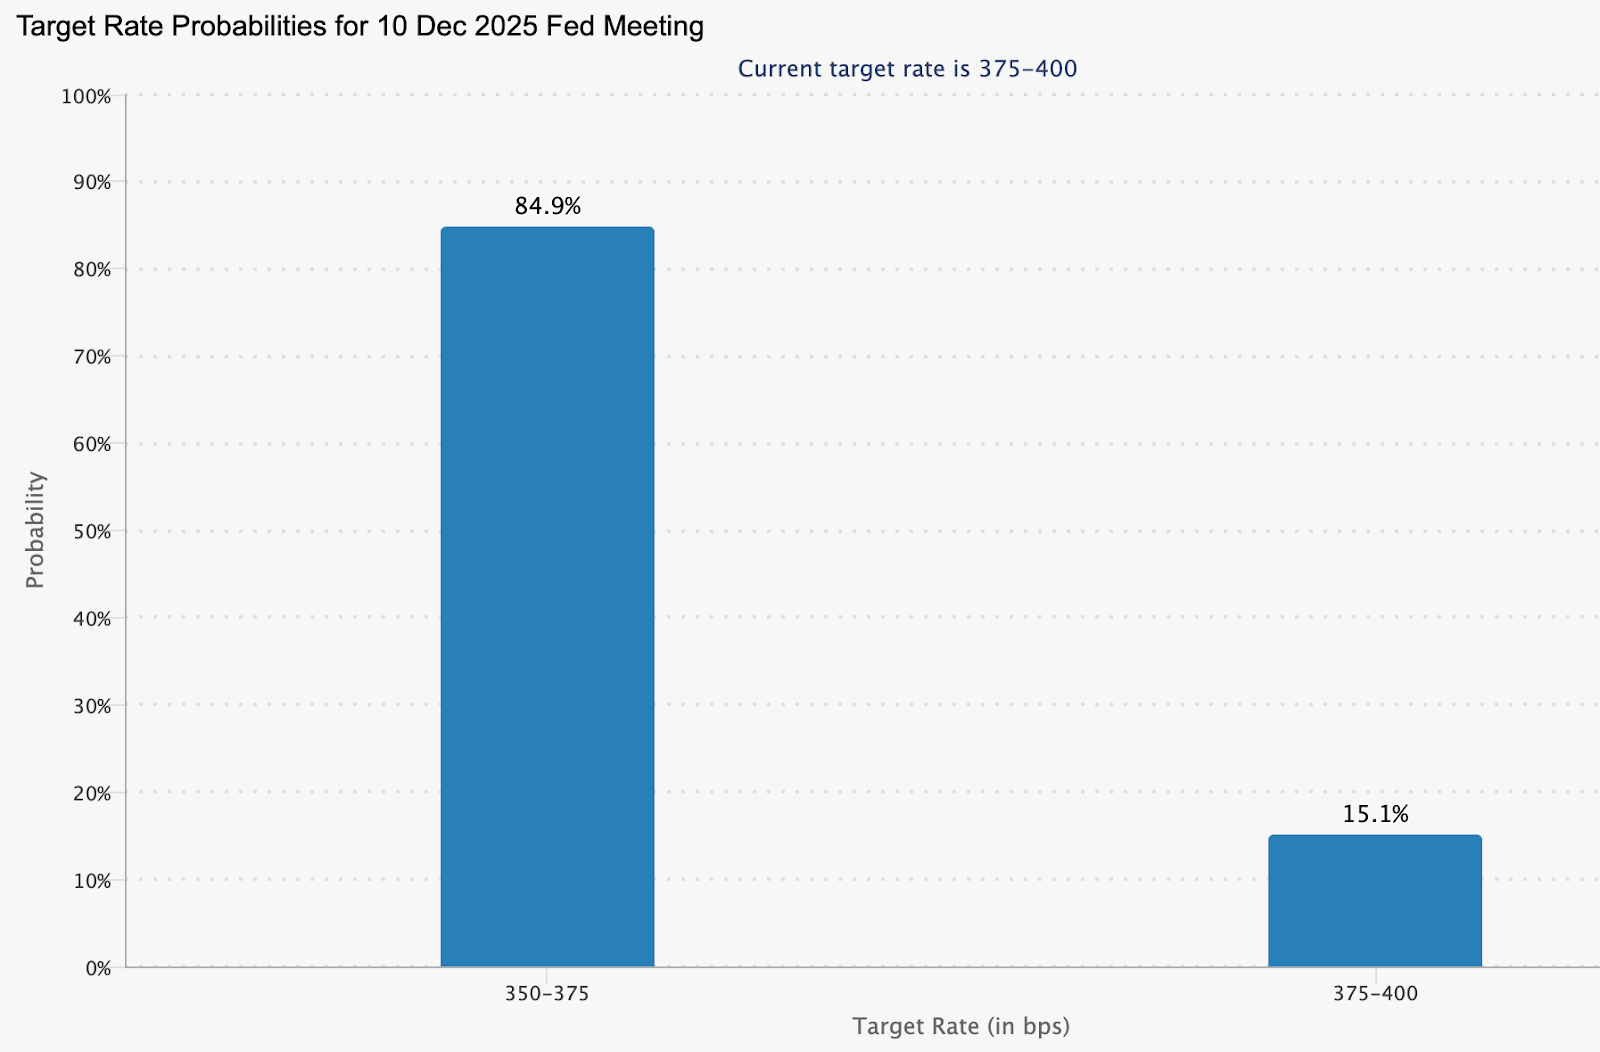
Market pricing leans heavily toward Fed easing, with the CME FedWatch Tool data as of 26 November showing an 84.9% probability of a 25-basis-point reduction at the 10 December FOMC meeting.
This reflects softer US indicators, including recent jobs data that hasn't derailed cut expectations despite some internal Fed debate. Such a move would trim the US–Japan yield gap modestly, offering tailwinds to the yen independent of BoJ moves.
Why it matters
The December decisions will determine whether the yen’s months-long stasis finally resolves into a trend - a critical shift for traders, Japanese policymakers, and multinational firms managing currency exposure. A break from the 154–158 range would influence capital flows, hedging strategies, and carry-trade dynamics at a time when global FX volatility is already rising.
For Japan, the stakes are especially high. A stronger yen would ease imported inflation and energy-cost pressures, while a renewed slide would intensify political scrutiny and prompt the Ministry of Finance to consider direct intervention. For the US, the Fed’s decision will signal how confidently it believes inflation is returning to its target, shaping global risk appetite as the year-end approaches.
Breakout scenarios: Two paths for USD/JPY
These outcomes hinge on post-meeting commentary - hawkish BoJ signals or dovish Fed dots could exaggerate moves.
What to monitor closely
- Event timeline: Fed decision on 10 December; BoJ on 18–19 December.
- Volatility gauges: One- and two-week option-implied vol expected to spike, signaling hedge flows.
- The intervention threshold of 157–160 remains a political flashpoint for Ministry of Finance action.
USDJPY technical insights
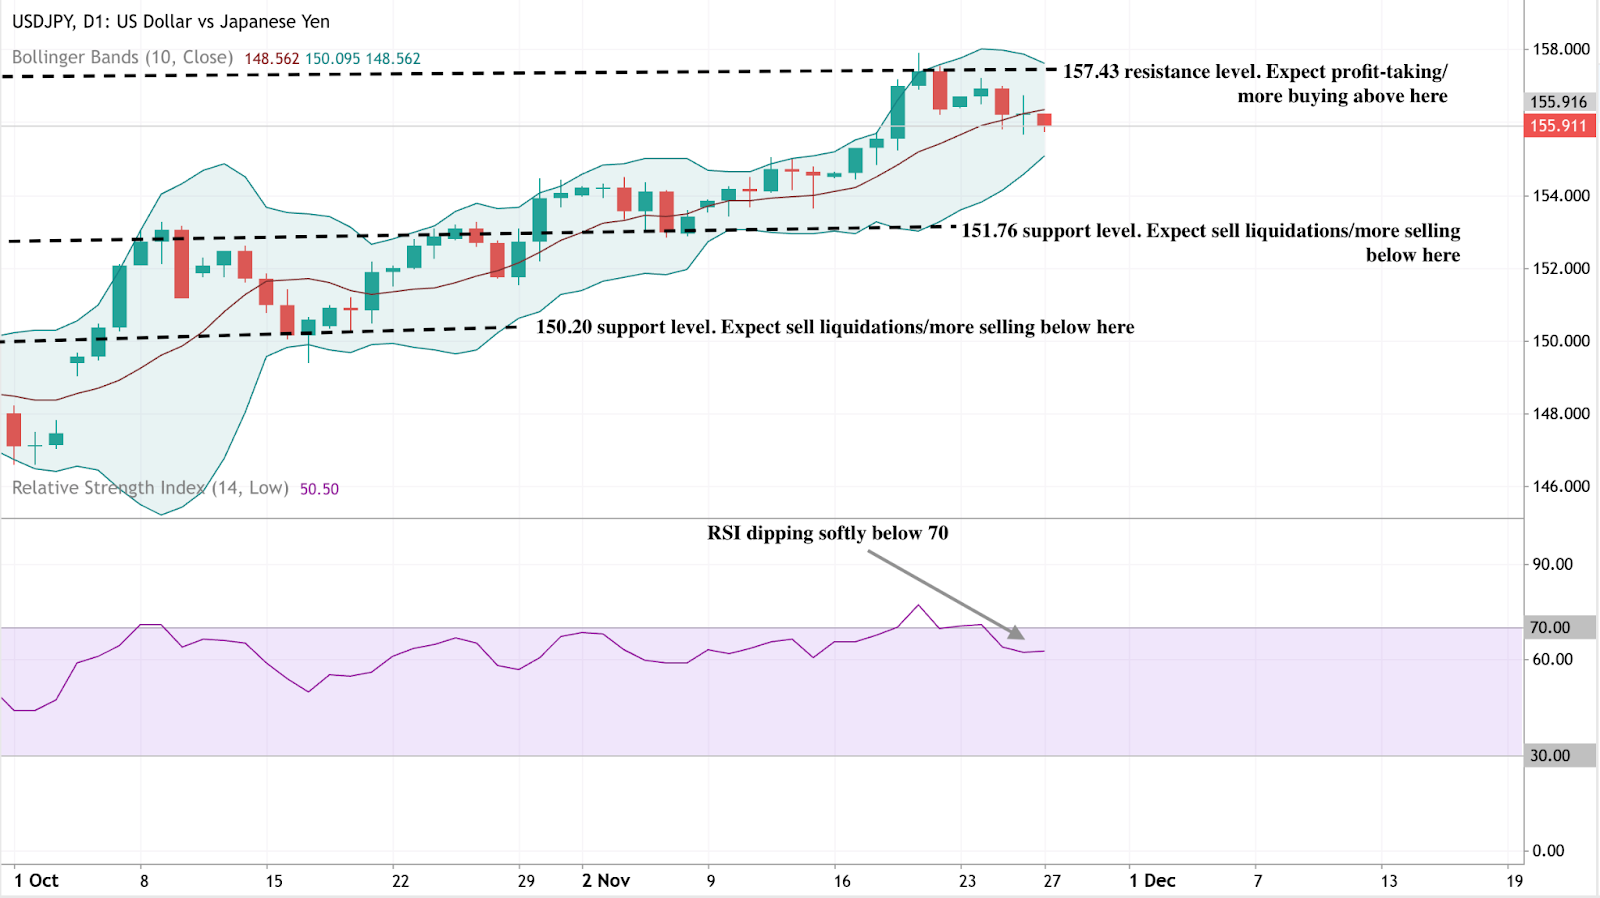
At the start of writing, USD/JPY is trading just below 156, easing slightly after failing to hold levels near the 157.43 resistance zone - an area where traders typically look for profit-taking or fresh upside breakouts. The pair now sits above two key supports at 151.76 and 150.20; slipping below either level could trigger sell liquidations and a deeper corrective move toward the lower Bollinger Band.
Despite the recent pullback, price action remains broadly constructive, with the pair still riding the middle Band and holding below the short-term moving averages.
The RSI, meanwhile, has dipped gently below 70, signalling that bullish momentum is cooling after a stretch of overbought readings. This soft decline hints at consolidation rather than a full reversal, suggesting the pair may trade sideways while the market waits for new catalysts, such as U.S. data or Bank of Japan commentary, to determine its next leg.

빅테크의 2025년 AI 설비투자 경쟁: Amazon, 1,250억 달러 이상으로 선두
수치는 놀랍습니다. 2025년, Amazon, Microsoft, Alphabet, Meta는 총 3,600~4,000억 달러의 자본 지출을 예고하고 있습니다.
수치는 놀랍습니다. 2025년, Amazon, Microsoft, Alphabet, Meta는 총 3,600~4,000억 달러의 자본 지출을 예고하고 있습니다. 이는 전년 대비 약 60% 증가한 수치로, 대부분이 AI 관련 인프라(데이터 센터, 맞춤형 실리콘, GPU/Trainium 클러스터)에 집중될 예정입니다.
2025년 11월 24일, BNP Paribas Exane은 Amazon에 대해 아웃퍼폼(Outperform) 등급과 320달러의 목표가로 커버리지를 개시했습니다. 이는 주요 브로커 중 가장 높은 목표가로, 11월 26일 종가(약 230달러) 대비 약 39%의 상승 여력을 시사합니다.
2025년 설비투자 가이던스 - 빅4
| 회사 | 2025년 설비투자 가이던스 | 주요 AI 중점 분야 |
|---|---|---|
| Amazon | 1,250억 달러 이상 (2025년 여러 차례 상향) | AWS 하이퍼스케일 클러스터, Trainium/Inferentia 칩, 주권 및 정부 클라우드 |
| Microsoft | 800~1,210억 달러 (2026년 6월 회계연도 종료 기준) | Azure 확장, OpenAI 인프라, 엔터프라이즈 GenAI |
| Alphabet | 약 910억 달러 (850억 달러에서 상향) | Google Cloud TPU, 과거 용량 부족 해소 |
| Meta | 700~720억 달러 | Llama 모델, AI 기반 광고, 대규모 단일 사이트 데이터 센터 |
출처: 각사 공시, 실적 발표, BNP Paribas Exane, BBC, Bloomberg, Reuters
BNP Paribas Exane이 Amazon을 다르게 보는 이유
BNP Paribas Exane의 애널리스트들은 Amazon이 AI에 대한 투자 부족이나 후발주자라는 우려가 회사의 공개된 지출 및 파이프라인을 감안할 때 “과장되었다”고 주장합니다. Amazon의 재무팀은 2025년 설비투자 전망을 약 1,250억 달러로 논의했으며, 2026년에는 더 높은 수치를 기대하고 있습니다. 또한 대부분이 데이터 센터, 네트워킹, AWS용 자체 가속기 등 AI 중심 인프라에 집중되어 있다고 밝혔습니다.
이 보고서는 이번 설비투자 사이클에서 Amazon을 차별화하는 여러 요점을 강조합니다:
- 수직적 통합: Trainium 및 Inferentia와 같은 자체 AI 칩을 설계함으로써, 경영진은 타사 GPU에만 의존할 때보다 비용 및 효율성 측면에서 잠재적 이점이 있음을 시사했습니다. 이는 장기적으로 가격 및 용량 유연성에 도움이 될 수 있습니다.
- 다양한 수익화 채널: AI 인프라는 AWS 엔터프라이즈 및 정부 워크로드뿐만 아니라 광고 적합성 개선, 물류 최적화, 소비자 대상 서비스 향상 등 다양한 영역을 지원하도록 설계되어, Amazon이 인프라를 여러 방식으로 수익으로 전환할 수 있게 합니다.
- 장기 마진 스토리: 회사의 논리는 AWS 성장률이 중반 20%대로 재가속하고, 광고가 연 20~25% 이상 성장하는 시나리오를 참고하며, 이는 수년간 그룹 전체의 영업이익률 확대로 이어질 수 있음을 시사합니다. 다만 실제 결과는 실행력과 수요에 달려 있습니다.
주요 투자자 논쟁 및 리스크
| 논쟁 / 리스크 | 대표적 “강세론” 시각 | 대표적 “약세론” 시각 |
|---|---|---|
| 설비투자 규모 | 대규모 AI 설비투자는 클라우드, AI 서비스, 광고 등에서 장기 수요를 확보하기 위해 필수적이며, 현재의 지출은 워크로드의 구조적 성장을 반영한다고 봅니다. | 일부 투자자들은 수요보다 빠르게 용량이 추가되어 자본 수익률이 감소하고 자산이 미활용될 수 있는 과잉 투자 시나리오를 우려합니다. |
| 수익 실현 시점 | 긍정적인 평론가들은 2026~2027년 생성형 AI 프로젝트가 파일럿에서 본격 배포로 전환되면서, 특히 클라우드 및 엔터프라이즈 소프트웨어 분야에서 활용률과 수익화가 증가할 것으로 기대합니다. | 회의적인 시각은 단기적으로 자유현금흐름 압박과 실험이 대규모 반복적 AI 지출로 얼마나 빨리 전환될지에 대한 불확실성을 강조합니다. |
| 경쟁적 위치 | 지지자들은 Amazon의 칩부터 클라우드, 소비자 애플리케이션까지 아우르는 풀스택 전략이, 스택의 개별 계층에 집중하는 경쟁사 대비 지속 가능한 강점이라고 봅니다. | 비판론자들은 Microsoft Azure와 Alphabet/Google Cloud의 강한 모멘텀을 지적하며, 단일 기업이 명확한 우위를 지속할 수 있을지 의문을 제기합니다. |
| 거시경제 민감도 | 일부는 클라우드와 AI 지출이 “인프라화”되어, 소비 지출이 둔화되더라도 특히 미션 크리티컬 워크로드에서는 견고함을 유지할 것이라고 주장합니다. | 다른 이들은 전반적인 경기 둔화가 디지털 광고 예산과 전자상거래 물량에 부담을 줄 수 있다고 우려합니다. 이는 Amazon과 Meta의 핵심 수익원입니다. |
주요 촉매/데이터 포인트
- AWS re:Invent - 2025년 12월 초
시장 참여자들은 새로운 AI 서비스, 모델 제공, 용량 확장 발표와 함께, 실제 생산 규모 워크로드를 보여주는 고객 사례 발표에 주목할 것으로 보입니다.
- Amazon 2025년 4분기 실적 - 2026년 1월 말/2월 초 발표 예상
주요 체크 포인트는 AWS 매출 성장률, 부문별 영업이익, AI 기반 수요 및 2026년 설비투자 계획에 대한 경영진 코멘트입니다.
- 동종업계 실적 및 가이던스 업데이트 - 2026년 초
2026년 초 Microsoft, Alphabet, Meta의 실적 발표에서는 설비투자 추이, AI 제품 도입 현황, 각사가 투자와 자유현금흐름의 균형을 어떻게 맞추는지에 대한 새로운 정보가 제공될 것으로 기대됩니다.
이러한 이벤트들은 AI 투자가 얼마나 빠르게 매출로 이어지는지, 그리고 설비투자 수준이 2026년에도 고공행진을 이어갈지, 완화될지, 혹은 추가로 증가할지에 대한 더 명확한 그림을 제시할 수 있습니다.
Amazon 기술적 인사이트
작성 시점에서 Amazon(AMZN)은 약 229달러에 거래되고 있으며, 최근 저점에서 소폭 반등해 218.45달러와 213달러의 주요 지지선 위를 유지하고 있습니다. 이 구간 아래로 하락하면 매도 청산이 촉발될 수 있으며, 반대로 상승 시 250.15달러 저항선이 다시 주목받을 수 있습니다. 이 구간에서는 트레이더들이 차익 실현을 하거나 신규 매수세가 유입될 수 있습니다.
RSI는 50 부근에서 횡보하며, 중립적 모멘텀을 시사하고 최근 조정 이후 시장이 아직 방향성을 모색 중임을 보여줍니다.


XRP 가격 전망: ETF 모멘텀과 매도세가 충돌할 때 다음은?
XRP의 가격 전망은 ETF 모멘텀의 급등이 대규모 매도세와 정면으로 충돌하면서 이례적으로 긴장된 상태가 되었습니다.
XRP의 가격 전망은 ETF 모멘텀의 급등이 대규모 매도세와 정면으로 충돌하면서 이례적으로 긴장된 상태가 되었습니다. 11월 21일 미국에서 여러 ETF가 승인되며, 일부는 첫날 거래량이 5,000만 달러를 넘었다고 시장 분석가 Eric Balchunas는 전했지만, XRP는 오히려 광범위한 암호화폐 매도세 속에서 고점 2.29에서 2.18로 하락했습니다. 구조적 진전과 시장 압력 간의 이 모순이 현재의 시장 환경을 규정하고 있습니다.
이 충돌은 투자자들에게 날카로운 질문을 던집니다. 규제된 ETF 자금 유입이 장기적인 재평가의 기반이 될 것인가, 아니면 지속적인 매도세가 심리를 압도해 시장을 더 깊은 조정으로 이끌 것인가? XRP는 현재 기술적·심리적 전환점에 놓여 있으며, 이 긴장의 해소가 다음 주요 움직임을 결정할 것입니다.
XRP의 최근 변화, 무엇이 이끄는가?
보도에 따르면, XRP의 최근 가격 움직임은 두 가지 상반된 내러티브에 의해 형성되고 있습니다. 한편으로는 24HrsCrypto, Black Swan Capitalist의 설립자 Versan Aljarrah 등 오랫동안 야심찬 목표를 주장해온 분석가들이 XRP의 가치는 소매 투자자들의 과대광고가 아니라 글로벌 결제 수요에 궁극적으로 달려 있다고 계속 주장합니다.
이들의 견해는 비트코인은 투기적 기대감에 오르지만, XRP의 장기적 상승 여력은 “유틸리티, 결제 수요, 글로벌 유동성 필요성”에 달려 있다는 것입니다. 이 분석가들은 인내심 있는 매집과 기관 채택이 XRP 가치 창출의 핵심이라고 강조합니다.
이러한 테마는 주요 규제 변화와 맞물렸습니다. 미국에서 여러 XRP ETF가 공식 승인된 것입니다. NYSE에서 Franklin Templeton의 ETF가 인증되고, Bitwise, 21Shares 등에서 상품이 출시되면서 전통 투자자들을 위한 깔끔하고 규정에 부합하는 진입로가 마련되었습니다.
초기 자금 유입은 진정한 관심을 반영합니다. Bitwise는 첫날 거래량이 2,200만 달러를 기록했고, Canary Capital의 XRPC 상품은 5,800만 달러로 올해 가장 강력한 출발 중 하나를 보였습니다. 이러한 상품들은 현물 시장이 여전히 변동성이 크더라도 XRP의 잠재적 수요 기반을 넓히고 있습니다.
왜 중요한가
시장 분석가들은 ETF 승인이 XRP의 장기 신뢰도에 구조적 상승 효과를 준다고 밝혔습니다. Bitwise는 자사 ETF 출범을 “역사적 순간”이라고 표현하며, 규제된 상품이 여전히 디지털 자산에 신중한 금융 자문가와 연기금 관리자들에게 신뢰를 준다고 강조했습니다. 이 투자자들은 규제 승인 후 수개월이 지나야 본격적으로 결정하는 경우가 많아, 포트폴리오 구조가 조정되는 2026년에 의미 있는 자금 유입이 나타날 수 있음을 시사합니다.
하지만 단기 심리는 다른 이야기를 보여줍니다. ETF 이정표에도 불구하고 XRP가 2달러 아래로 떨어진 것은 당장의 시장 환경이 얼마나 취약한지 보여줍니다. Glassnode 데이터에 따르면 유통량의 41.5%가 현재 손실 상태에 있어, 트레이더들이 투매하면서 압력이 가중되고 있습니다.

고래들의 활동이 하락세를 심화시켰으며, ETF 소식이 나온 후 이틀 만에 2억 개 이상의 XRP가 매도되었습니다. 구조적 이득과 단기 약세 간의 이 괴리가 이제 XRP 전망의 핵심이 되고 있습니다.
시장과 투자자에 미치는 영향
최근 보도에 따르면, Ripple의 기관 전략이 XRP의 궤적에 또 다른 차원을 더하고 있습니다. 회사가 Hidden Road를 12억 5천만 달러에 인수해 Ripple Prime으로 리브랜딩한 것은 암호화폐 네이티브 기업이 글로벌 멀티에셋 프라임 브로커를 소유한 첫 사례입니다.
이 플랫폼은 연간 3조 달러를 결제하며, Ripple 경영진은 인수 이후 상당한 성장을 보고 있다고 밝혔습니다. XRP와 RLUSD는 기관 고객을 위한 담보로 활용될 예정으로, 토큰을 전문 트레이딩 및 결제 인프라에 정착시키려는 움직임을 시사합니다.
관찰자들은 이 변화가 중요하다고 봅니다. 프라임 브로커리지는 기관 자본 흐름의 신경망 역할을 하기 때문입니다. XRP를 담보 및 결제 채널에 내재화하면 소매 투자 열기에 의존하지 않는 유동성 경로가 강화됩니다. Hidden Road의 빠른 확장은 규정에 부합하는 디지털 자산 도구에 대한 수요가 계속 증가하고 있음을 보여줍니다. 투자자 입장에서는, 단기 차트가 약세를 보이더라도 펀더멘털 인프라가 개선되는 이례적인 상황이 연출되고 있으며, 이는 전환기 시장에서 흔히 나타나는 패턴입니다.
전문가 전망
기술적 분석가들은 XRP가 중대한 임계점에 접근하고 있다고 설명합니다. 2.195달러를 회복하면 안정화 신호로 간주되어 2.6달러까지의 경로가 열릴 수 있지만, 2달러를 잃으면 1.5달러까지 하락해 장기 투자자들이 재매집을 시도할 수 있습니다. 한때 인기 있던 3.6달러 목표는 이제 전체 암호화폐 심리가 반전되지 않는 한 멀게 보입니다.
장기적 논쟁은 여전히 양극화되어 있습니다. 100달러 논지를 지지하는 이들은 XRP의 미래가 투기적 사이클이 아니라 유동성 인프라와 기관 결제에 달려 있다고 주장합니다. 반면 비평가들은 자문가와 규제된 펀드가 본격적으로 자금을 배분하는 2026년이 되어야 실질적인 자금 유입이 나타날 것이라고 봅니다. 거시적 역풍과 비트코인의 방향성도 여전히 중요합니다. 시장 전반의 반등이 있다면 ETF 수요가 증폭될 수 있지만, 약세가 지속되면 XRP는 지지선 부근에 머물 수 있습니다.
핵심 요약
많은 이들이 말하듯, XRP의 전망은 ETF 주도의 낙관론과 대규모 매도 압력의 충돌에 의해 결정되고 있습니다. 분석가들은 기관 통합을 통해 근본적 생태계가 강화되고 있다고 평가하지만, 고래들의 분산과 거시경제적 위험자산 압력으로 가격은 여전히 취약합니다. 다음 주요 움직임은 XRP가 2달러 구간을 회복하고, 지속적인 ETF 자금 유입을 유치하며, 암호화폐 전반의 반등을 탈 수 있는지에 달려 있습니다. 이 힘들의 균형이 2026년까지의 궤적을 결정할 것입니다.
XRP 기술적 인사이트
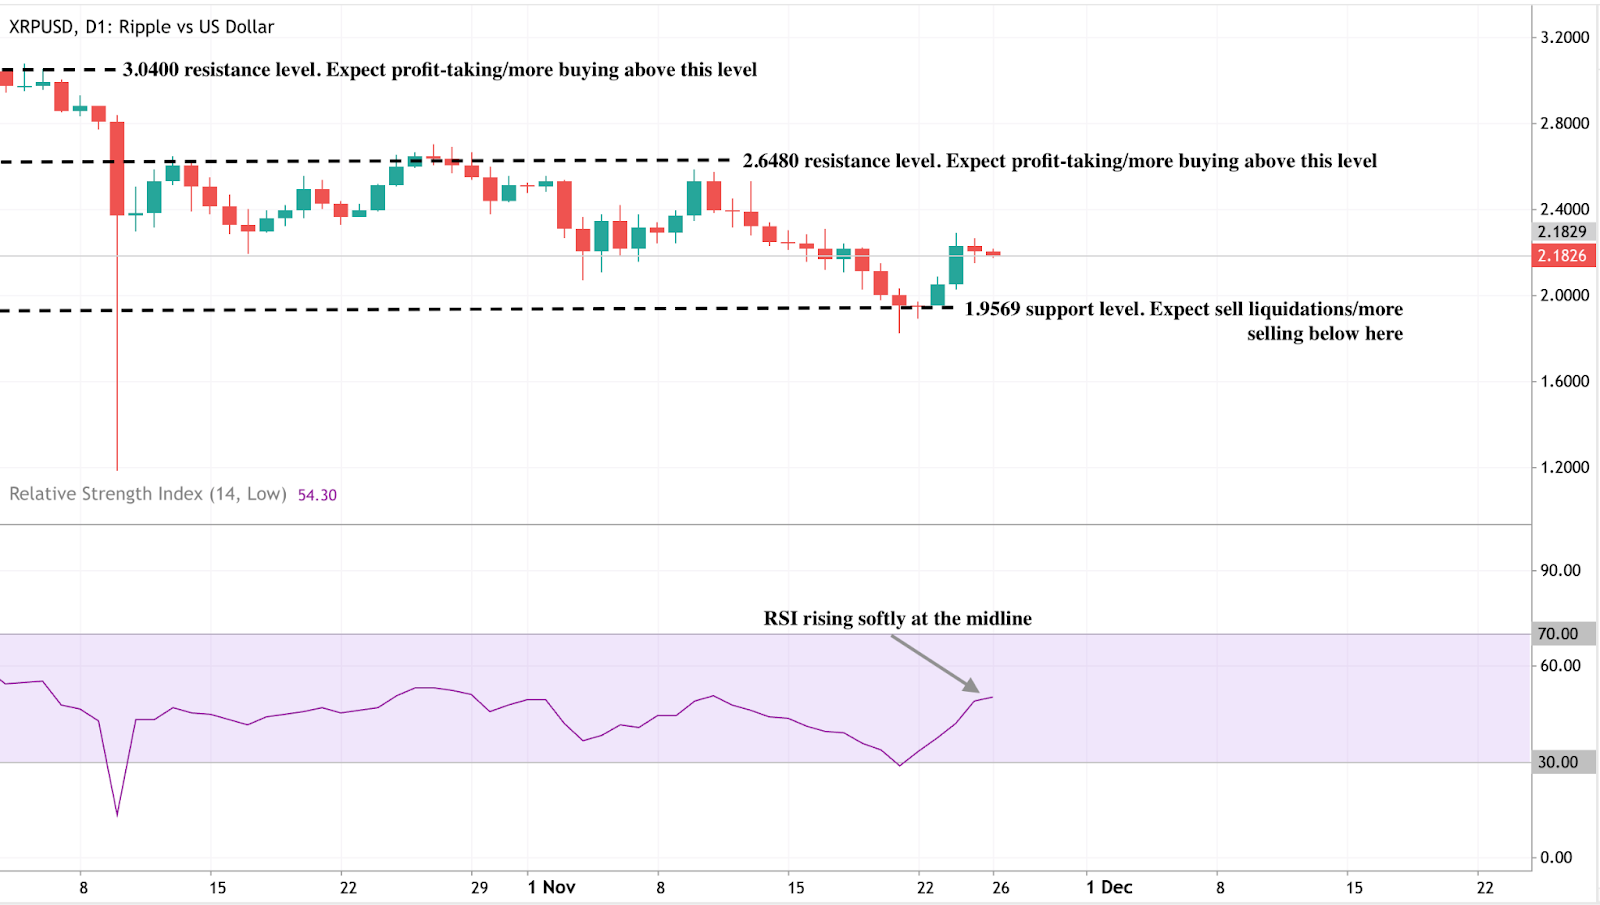
작성 시점에서 XRP/USD는 약 2.1800달러에서 움직이고 있으며, 주요 저항선 2.6480달러와 강한 지지선 1.9569달러 사이에서 거래되고 있습니다. 지지선 아래로 하락하면 매도 청산이 촉발될 수 있고, 2.6480달러 또는 3.0400달러 위로 상승하면 차익 실현 또는 신규 매수세가 유입될 수 있습니다.
RSI는 약 54의 중간선에서 완만하게 상승 중으로, 모멘텀의 완만한 회복을 시사하지만 아직 과매수 신호는 아닙니다.
.png)
Google’s AI comeback: Has the sleeping giant finally awoken?
Google has been criticised for years for lagging behind OpenAI, especially after ChatGPT exploded in late 2022 and reshaped the AI landscape.
Google has been criticised for years for lagging behind OpenAI, especially after ChatGPT exploded in late 2022 and reshaped the AI landscape. Yet the company’s recent streak of breakthroughs has triggered a dramatic reappraisal.
At the centre of this shift is Gemini 3, Google’s newest flagship AI model, which has impressed analysts with its performance in reasoning, coding and specialised tasks that traditionally stump chatbots. As demand grows for both cloud compute and Google’s custom AI chips, investors are beginning to question whether Google’s comeback is already underway - and whether the AI race is entering a new phase.
What’s driving Google’s resurgence
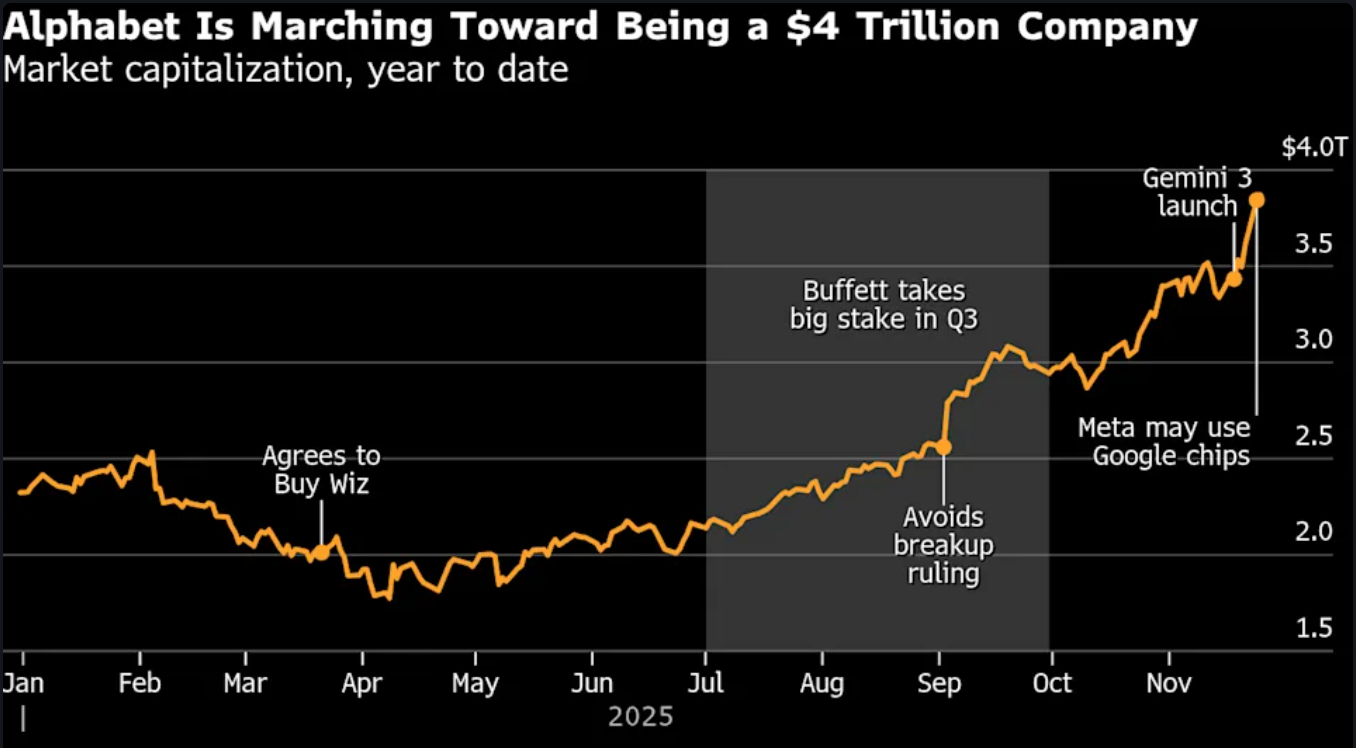
Alphabet has gained substantially since mid-October, sending shares to $323.64 and bringing it within reach of the $4 trillion club.
Google’s return to form is rooted in a combination of technical breakthroughs and strategic repositioning. The launch of Gemini 3 captured global attention after the model surged to the top of AI leaderboards such as LMArena and Humanity’s Last Exam, winning praise from analysts and technologists for its reasoning ability and performance on complex science tasks
Its improved reliability in generating images with accurate embedded text - a challenge that has plagued many chatbots - signals a maturity necessary for enterprise adoption. At the same time, Google has refreshed its AI product suite, including updates to its viral Nano Banana generator, which reinforces momentum across both consumer and developer segments.
The second force propelling Google forward is its deep investment in infrastructure. Once criticised for falling behind Microsoft, OpenAI and Nvidia, the company now benefits from rising demand for Google’s Tensor Processing Units (TPUs) - a specialised chip architecture Google has refined for over a decade.
Reports that Meta is in talks to deploy Google’s chips in its data centres by 2027 triggered a rally in Alphabet stock, demonstrating that Google’s hardware ecosystem may finally offer a meaningful alternative to Nvidia’s dominant GPUs. Partnerships with Anthropic - potentially involving up to 1 million TPUs - further signal a structural shift in AI compute preferences.
Why it matters
Google’s resurgence has implications far beyond its own balance sheet. As Neil Shah of Counterpoint Research put it, “Google has arguably always been the dark horse in this AI race — a sleeping giant now fully awake.” . If Gemini 3 continues to outperform expectations, it may reshape competitive dynamics between the three pillars of modern AI: OpenAI for model innovation, Nvidia for hardware, and Microsoft for cloud and enterprise distribution. A strengthened Google challenges this equilibrium, creating new strategic options for companies seeking alternatives to Nvidia’s high-cost GPUs or Microsoft’s deep integrations with OpenAI.
The return of competitive balance is also important for consumers and regulators. Google escaped the most severe outcome in a US antitrust case partly because AI competition has intensified. If Google proves it can innovate at scale, it may relieve pressure on regulators while accelerating the adoption of AI products beyond search advertising.
Units like Waymo, which is expanding into multiple cities and now supports highway driving, illustrate how Alphabet’s deep research pipeline fuels progress beyond software. The question is whether Google can convert technical superiority into commercial leadership - something it has historically struggled with outside advertising.
Impact on industry, markets and consumers
Google’s ascent poses both opportunity and disruption across the tech landscape. Nvidia, which lost $150 billion in market value on the day Meta’s chip discussions were reported, now contends with the prospect of a viable alternative for certain AI workloads. While Nvidia insists its GPUs remain the industry’s Swiss Army knife - flexible, widely supported, and essential for model training - TPUs give Google a niche advantage. As ASIC-based designs gain traction, analysts expect custom silicon to grow faster than the GPU market over the next several years.
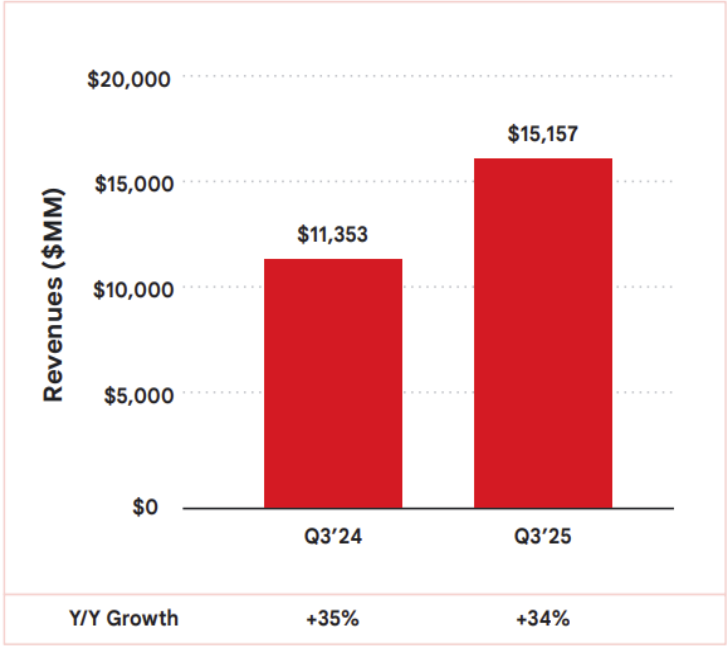
This shift has a significant impact on the broader cloud industry. Google Cloud, which generated $15.2 billion in third-quarter revenue - up 34% year-on-year - remains behind AWS and Microsoft Azure, but the demand for generative-AI compute is narrowing the gap.
Companies attracted by TPUs' cost efficiency may choose Google Cloud for specialised workloads, while still relying on Nvidia GPUs for general tasks. For consumers, the competition translates into better AI experiences: models with stronger reasoning, fewer errors, and safer behaviour.
Across financial markets, Alphabet’s rally affects index weightings and rotation patterns. As traders reassess Google’s valuation, volatility in Nvidia, AMD, Microsoft and Meta increases - creating opportunities for directional and event-driven strategies on platforms like Deriv MT5, where both tech stocks and index CFDs see heightened activity during AI-driven shifts. Tools such as the Deriv Trading Calculator help quantify margin impact and manage exposure as market reactions intensify.
Expert outlook
Forecasts for Google’s next phase remain divided. Some analysts argue that Google’s resurgence marks a long-awaited payoff from its “full-stack” strategy - controlling data, models, chips, cloud and applications. CEO Sundar Pichai emphasised during the last earnings call that this unified approach “really plays out” when scaling frontier models that integrate reasoning, multimodal capabilities and advanced coding. If Google continues to refine its ecosystem, it could rival or surpass OpenAI in enterprise adoption while weakening Nvidia’s dominance in hardware.
Yet uncertainties persist. Data revealed consumer adoption of Gemini still lags behind that of ChatGPT, with 650 million users compared to ChatGPT's 800 million weekly users, and monthly downloads of 73 million, which trail ChatGPT’s 93 million. Google Cloud, although accelerating, is still half the size of AWS and Azure.
It was noted that if Google cannot convert its technological strength into sustained commercial traction, the gap could widen again. Much will depend on whether Meta and other AI-intensive companies formalise their TPU commitments and whether Gemini 3 continues outperforming rivals in real-world deployments. The next six to nine months will be decisive, according to analysts.
Key takeaway
For market watchers, Google’s rapid AI resurgence suggests the company has moved far beyond its defensive posture of recent years. Gemini 3’s strong performance, rising TPU adoption and fresh cloud momentum have revived Alphabet’s standing in the global AI race. Yet the outcome is far from settled.
The next phase hinges on whether Google can scale its breakthroughs commercially while sustaining hardware and model performance. Traders and analysts await confirmation from enterprise adoption, chip-supply agreements and quarterly cloud-revenue growth - the indicators that will decide whether this comeback becomes a lasting transformation.
Alphabet technical insights
At the start of writing, Alphabet (GOOG) has broken into a price discovery zone above $323, signalling strong bullish momentum after an extended run along the upper Bollinger Band. Key supports sit at $268.75 and $240, where a drop below either level could trigger sell liquidations or deeper pullbacks.
The RSI, now around 74, is approaching overbought territory, highlighting stretched conditions that may lead to short-term cooling or consolidation, even as the broader trend remains firmly upward.


Gold’s November surge: From $4,000 barrier to all-time highs. What’s really happening?
Imagine waking up to headlines screaming 'Gold Smashes Past $4,300,' and no, it’s not a dream; it has been the reality of October 2025.
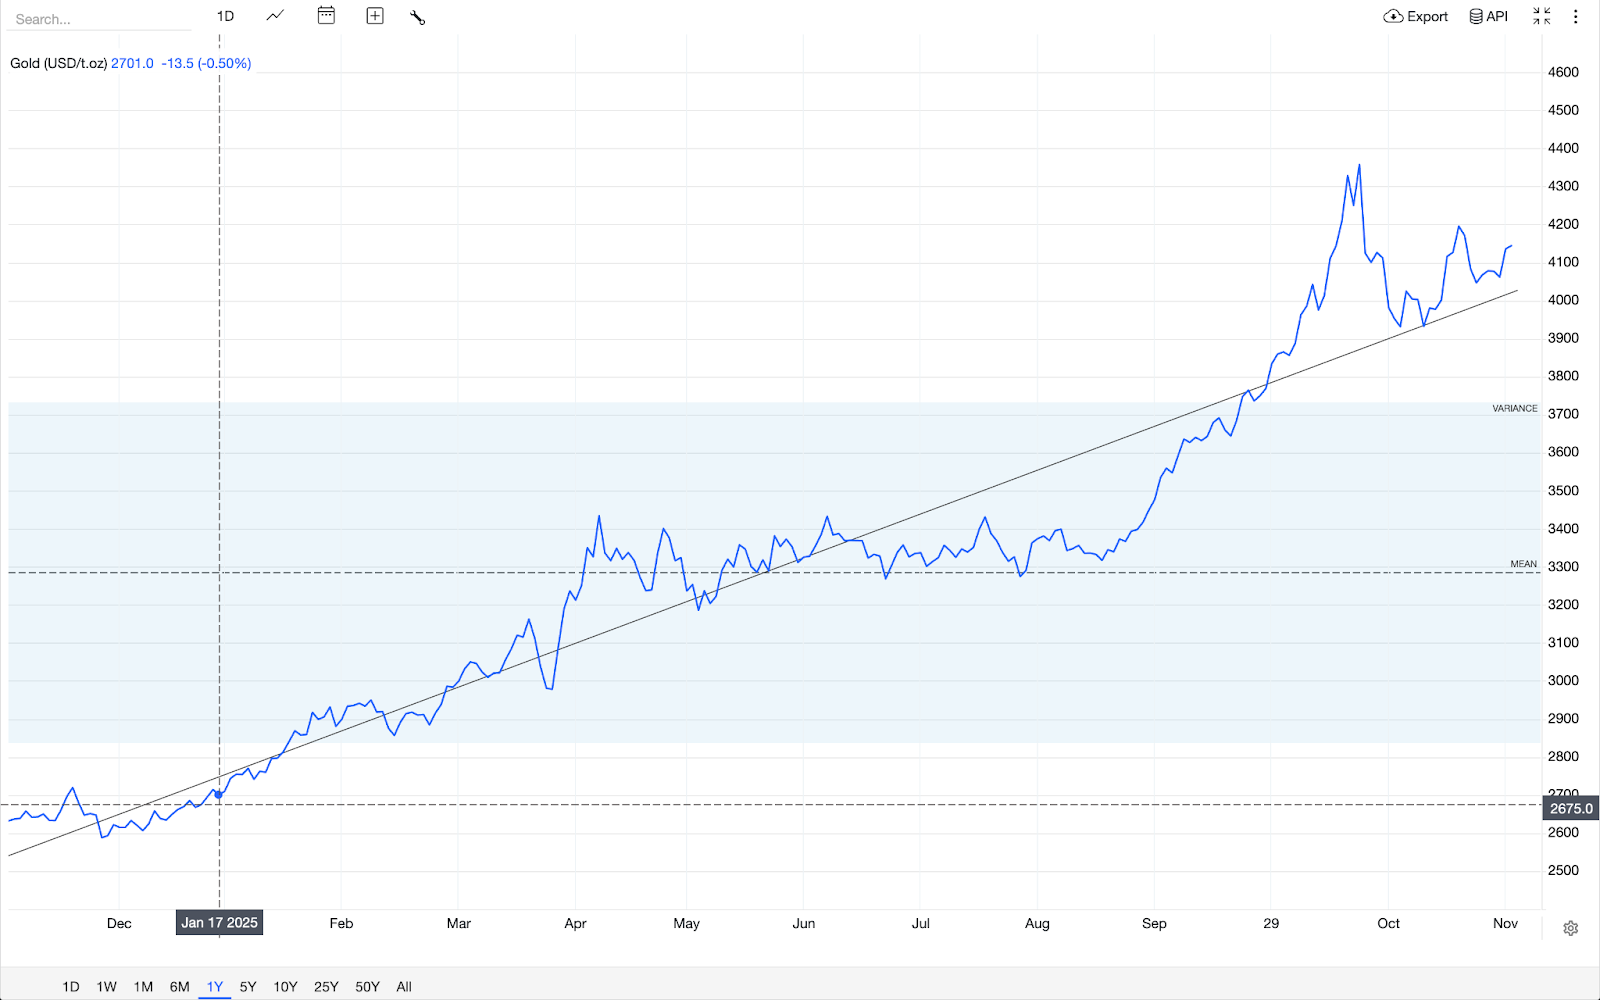
Imagine waking up to headlines screaming 'Gold Smashes Past $4,300,' and no, it’s not a dream; it has been the reality of October 2025. Now, November’s keeping the momentum alive with prices hovering near $4,132 as of 25 November 2025. If you’re wondering whether this shiny metal remains a smart addition to your financial mix, stick around. We’re breaking down the fresh data, historical peaks, and practical takeaways without the hype.
Why is gold climbing so sharply in late 2025?
The gold spot price breached $4,100 per ounce on November 24, a 1.65% increase from the prior day, driven by investor bets on U.S. Federal Reserve rate cuts amid cooling inflation signals. This isn't random volatility; it's a response to broader economic jitters. Geopolitical tensions, like ongoing Russia-Ukraine talks, add a layer of safe-haven demand, pushing prices up even as crude oil dips on "peace" rumours.
Breaking it down: Central banks worldwide are projected to acquire over 900 tons of gold in 2025, according to reports, surpassing demand for jewellery and technology. This institutional buying creates a floor under prices - think of it as a global vote of confidence in gold as a hedge against currency wobbles.
For everyday folks, it means reviewing your asset allocation might reveal whether gold’s 58% year-to-date gain (from -$2,600 in January) aligns better with your risk tolerance now than it did during last year’s flatline.
How close is gold to its historic peaks, and what do the charts say?
Gold’s all-time high? $4,379.13 on October 17, 2025, eclipsing the inflation-adjusted 1980 record of about $3,400 (when an ounce topped $850 nominally). Fast-forward to November: Spot prices traded between $4,046 and $4,145 on 24 November, coiling in a bull pennant pattern on daily charts - a setup that hints at continuation if it breaks upward, based on Kitco’s intra-day analysis.
Visualise this: On a 5-minute Comex futures chart, gold is hugging the 50-period moving average as support around $4,010, with resistance at $4,108. Zoom out to weekly: It’s testing the upper Bollinger Band after a 3.7% monthly rise.

Historically, such consolidations after highs (like the post-2020s $2,070 peak) often precede 10-15% corrections or fresh legs up - a reminder to track these levels when assessing gold’s role in long-term savings, such as in a retirement portfolio.
Expert take: "Gold’s resilience stems from its inverse correlation to real yields,” notes FX Empire analyst Yoav Niv, who points to the metal’s consolidation amid delayed U.S. data releases. Actionable angle? If inflation reports this week nudge yields lower, gold could revisit its October high - use that as a cue to compare gold’s performance against your bond or cash holdings.
Gold’s role in everyday portfolios
Hypothetically, let’s consider a mid-40s couple in Chicago, facing 7% inflation that ate into their savings in 2024. So, they shifted 5% of their nest egg to a gold ETF in early 2025; by November, that slice would have grown 58%, offsetting spikes in grocery and housing costs. Nothing magical here, but gold acting as a diversifier when stocks wobble.
Or take an example of a small business like a jeweller who rode out November’s uptick by locking in supplier rates at $4,000, buffering against dollar strength that hammered imports. The insight? Gold isn’t just for vaults; it’s a tool for smoothing cash flow volatility.
Scan your expenses - if currency fluctuations hit suppliers or travel, a modest gold exposure (via accessible ETFs) could stabilise planning without overcomplicating things.
November’s gold action underscores its enduring appeal: a buffer against the unpredictable. Whether eyeing historic charts or current consolidations, the key is integration - weave it into your financial story thoughtfully.
Gold technical insights
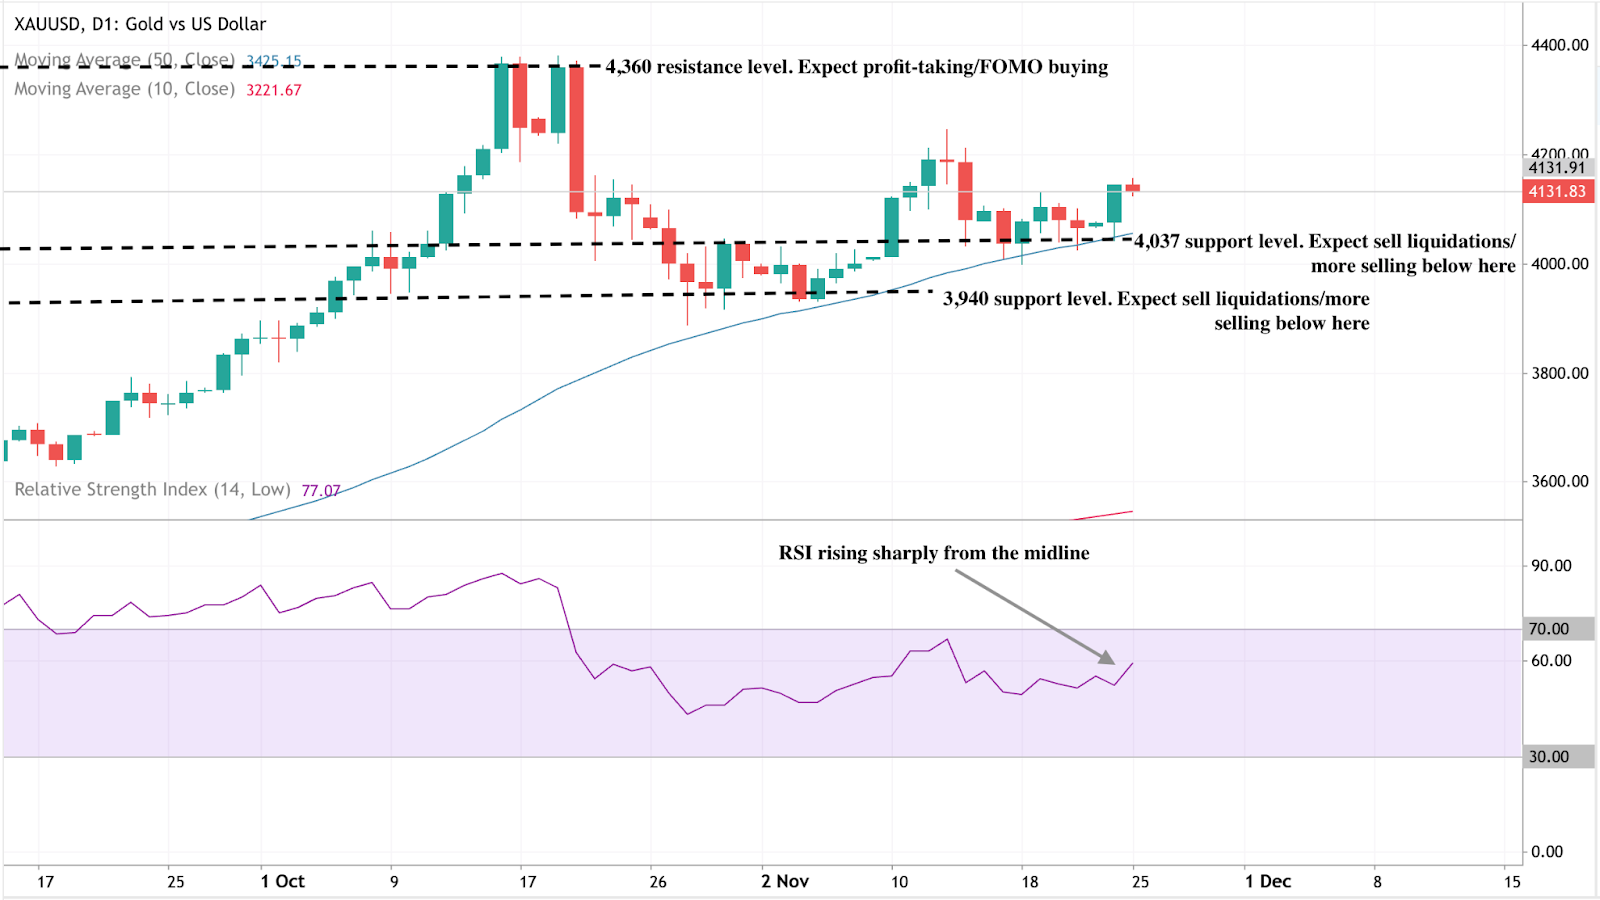
At the start of writing, Gold (XAU/USD) is trading near $4,132, maintaining bullish momentum above key supports at $4,037 and $3,940. A sustained move above these levels suggests buyers remain in control, though a drop below either could trigger sell liquidations.
The $4,360 level stands out as a major resistance, where traders may take profits or new buyers could enter on FOMO sentiment. Meanwhile, the RSI has surged to around 77, rising sharply from the midline - a signal of strengthening momentum but also a potential sign of overbought conditions that could invite short-term pullbacks.

The tech stock rally: Is this the start of a new cycle?
This week’s sharp rebound in tech stocks poses a compelling question: Is this more than just a bounce?
This week’s sharp rebound in tech stocks poses a compelling question: Is this more than just a bounce? With the Nasdaq Composite jumping 2.7% and the S&P 500 up roughly 1.5% as investors embraced both AI momentum and hopes for a December rate cut, the tone has shifted, according to reports.
The deeper issue, however, is whether this marks the beginning of a new tech cycle, underpinned by accelerating AI deployment and cheaper capital, or simply a rally within an existing one. The following insights examine what drives the move, its significance, its impact on markets, and what comes next.
What’s driving the tech stock rally
Market watchers say that at the heart of the current advance lie two forces: renewed confidence in AI-led innovation and fresh traction in monetary policy expectations. On the policy side, signals from the Federal Reserve, including Governor Christopher Waller and President John Williams of the New York Fed, have bolstered expectations for a December rate cut, helping to lift growth-stock valuations.
The reduction in discount rates on long-term earnings tends to favour tech firms, which rely on high forward-rate growth. Parallel to that, the AI story remains central. Firms such as Alphabet Inc. surged after enthusiasm for its Gemini model, while the “Magnificent Seven” pulled the broader tech cohort higher.
The market appears to be reconciling the earlier pullback (driven by bubble fears) and repositioning into stocks that benefit from the AI infrastructure build-out, including chips, cloud, and software. The question now is whether this is the launch of a new growth wave or simply the next leg of the existing one.
Why it matters
If tech is entering a new cycle, the implications extend far beyond a handful of large-cap stocks. These companies increasingly lag behind not only in market weight but also in shaping index trajectory, sector rotation, and investor psychology. As one analyst observed: “Scepticism around AI cap-ex might be a contrarian positive” for the trade in the long term.
For institutional and retail investors alike, the timing could matter: a true cycle shift may favour growth and innovation over value, alter asset-allocation flows, and provide a greater runway for risk assets. Conversely, if this is not a new cycle, then mispricing valuations could lead to sharp reversals. For corporates - from chip fabricators to SaaS startups - the cost of capital, demand for AI services, and global semiconductor supply chains all hinge on how the cycle evolves.
Impact on the market and industry
A credible new tech cycle would signal substantial real-world change: surging investment in data-centres, exponential scaling of AI models, and ecosystem shifts toward cloud-native, AI-first companies. We’re seeing some of that. Analysts estimate that AI could add $5-19 trillion in incremental revenue to US companies, although many warn that much of this may already be priced in.
In market terms, a cycle change could reinvigorate under-weight tech portfolios, trigger rotation out of value/cyclicals and reshape the “growth vs. value” trade. For the industry, this means that winners will likely emerge among firms that scale AI profitably, while laggards will face margin pressure, heavier capital expenditure burdens, and competitive erosion. The stakes are high: the surge could be transformative - but the infrastructure and competitive demands are intense.
For the market, that means volatility is likely to stay elevated. Traders balancing positions on platforms like Deriv MT5 can use advanced order types, leverage settings and stop-loss controls to navigate sharp swings. Understanding margin impact and exposure - via the Deriv Trading Calculator - is increasingly essential as the cycle matures.
Expert outlook
Looking ahead, professional traders note that key signals to monitor include inflation trajectories, clarity on Fed policy, earnings from major tech companies, and progress on supply-chain goals in the AI build-out. Markets currently price in a high probability of a December rate cut, but if inflation proves persistent or earnings disappoint, momentum could stall.
Some strategists caution that we may simply be in yet another leg of the initial tech-cycle rather than in the dawn of a fresh era. For instance, Goldman Sachs analysts suggest much of the potential upside from AI is already embedded in current valuations.
This means that while the upside exists, the risk-reward becomes less attractive. The best scenario: a renewed tech cycle with broad-based participation. The risk: concentrated gains, fading momentum and underlying disillusionment. Either way, the next few months will be critical.
Key takeaway
The surge in tech stocks carries more than a feel-good bounce - it could mark the opening stages of a new cycle where AI deployment and supportive policy drive sustained growth. However, the caveats remain substantial: valuations are stretched, execution risk is real, and macroeconomic headwinds loom. Investors should watch upcoming inflation data, Fed commentary and earnings from tech heavyweights as signals to validate the shift. The moment is promising, but not yet definitive.
Alphabet technical insights
At the start of writing, Alphabet’s stock (GOOG) has entered a price discovery zone above $318, signalling strong bullish momentum. The $280 and $238 levels act as key supports - a break below these zones could trigger sell liquidations or deeper corrections.
Meanwhile, the RSI has climbed to around 74.5, pushing into overbought territory, suggesting that the stock may face short-term profit-taking or consolidation before attempting further upside.

죄송합니다. 와(과) 일치하는 결과를 찾을 수 없습니다.
검색 팁:
- 철자를 확인하고 다시 시도해 주세요
- 다른 키워드로 시도해 보세요