S&P 500 outlook: Can the market absorb tight liquidity?

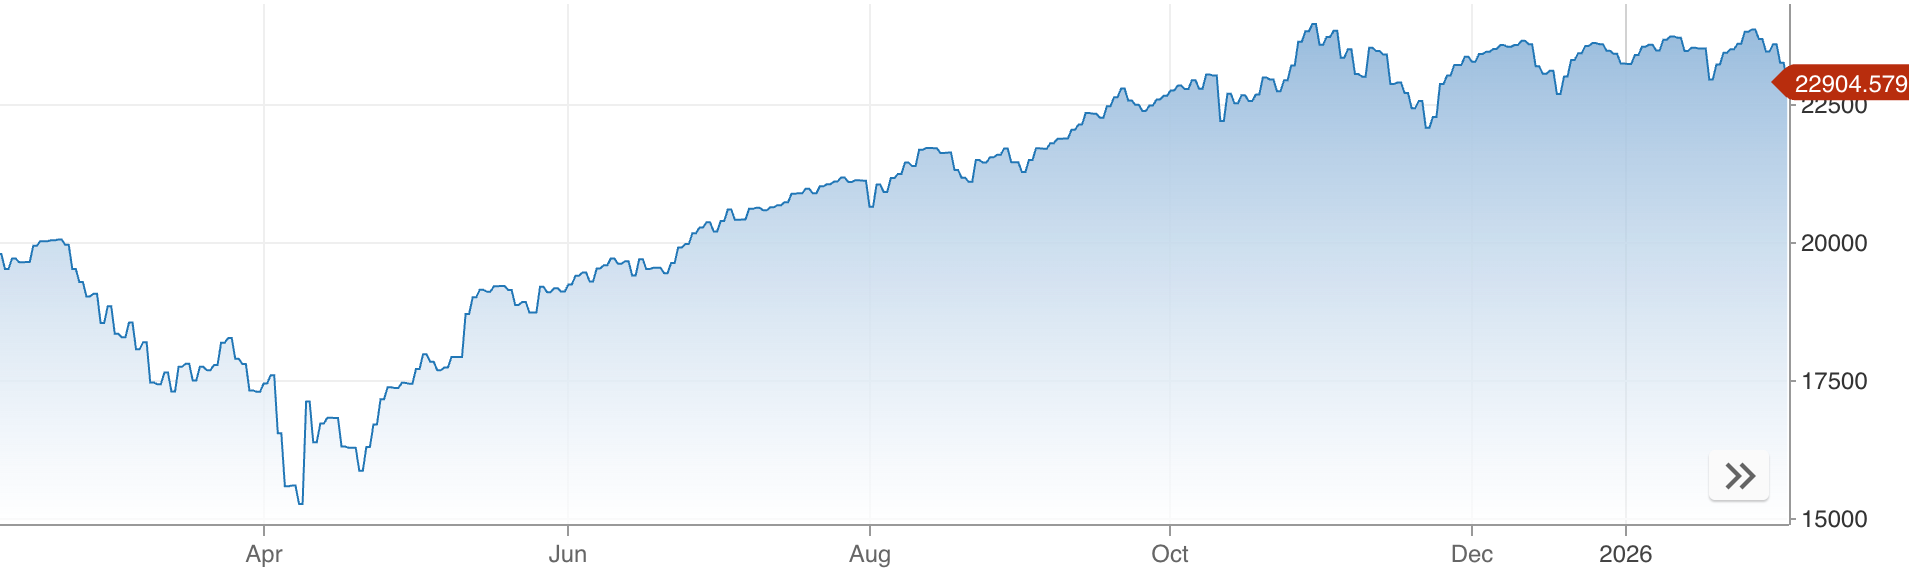
The short answer is yes - but not without strain. The S&P 500 is still holding near record levels, yet beneath the surface, market liquidity is tightening in ways that historically make equity rallies harder to sustain.
On Wednesday alone, the benchmark index slipped just 0.5%, while the equal-weighted S&P 500 jumped almost 0.9%, a divergence that pushed market dispersion close to the upper end of its historical range.
This matters because liquidity, not earnings, is increasingly setting the tone. With earnings season fading, long-dated bond yields hovering near resistance, and the US Treasury preparing to drain cash from the system, the market’s ability to absorb tighter financial conditions will define the next phase of the S&P 500’s trajectory.
What’s driving the S&P 500 outlook?
Recent price action shows a market being pulled in two directions at once. Mega-cap technology stocks have weighed on the headline S&P 500, while smaller constituents and defensive sectors have quietly advanced.
The result has been a sharp rise in dispersion, with the dispersion index climbing to around 37.6, a level more commonly associated with peak earnings volatility rather than the end of the reporting season.
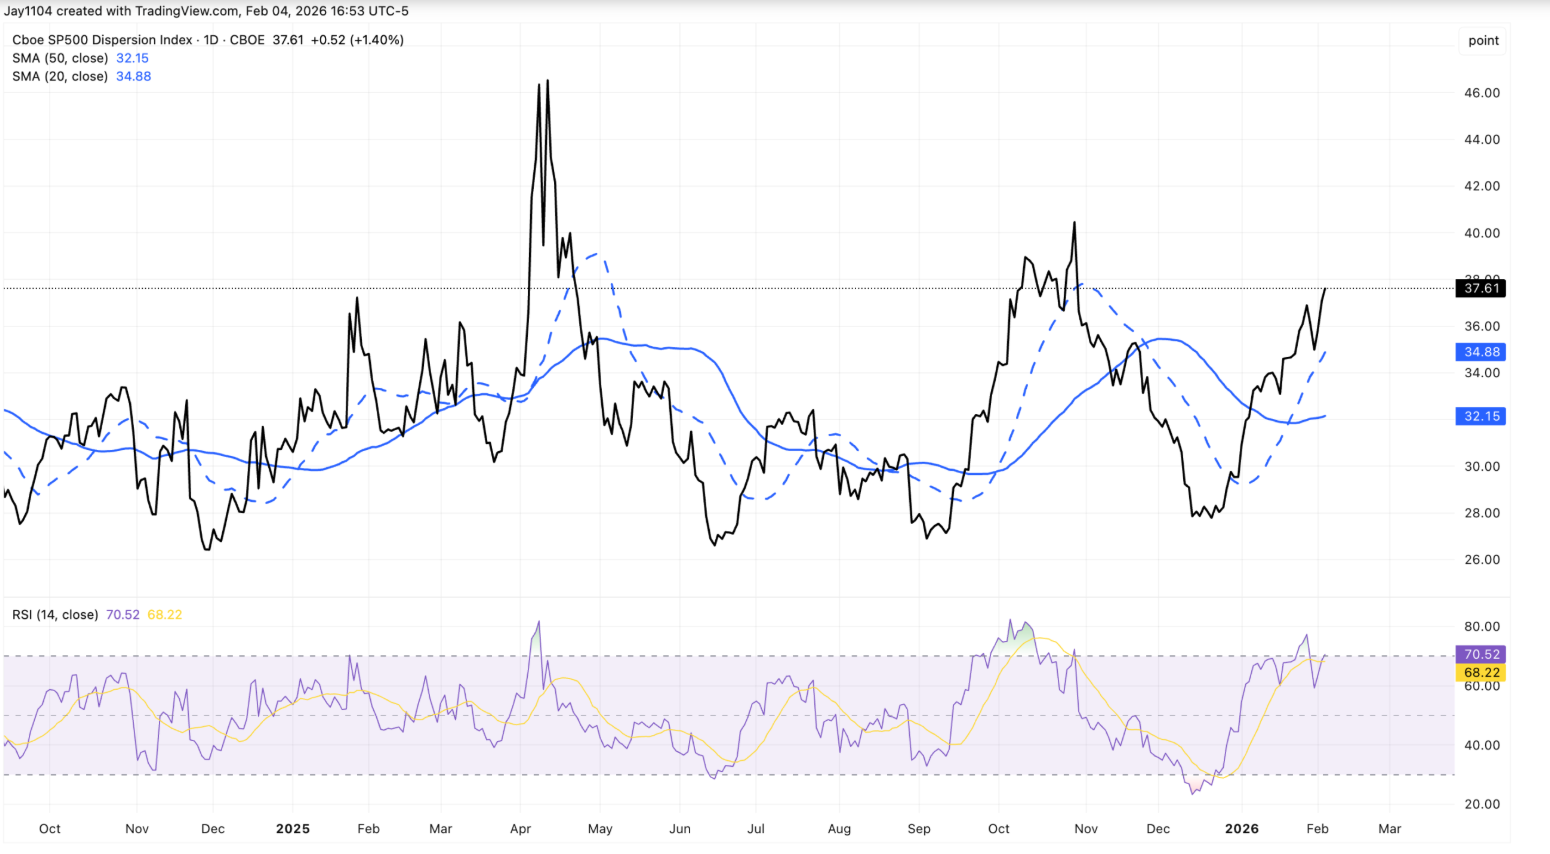
One explanation lies in positioning rather than conviction. Implied volatility has been rising more aggressively than in previous quarters, encouraging traders to lean into stable earnings profiles such as consumer staples. Walmart’s continued strength, despite not reporting earnings until mid-February, reflects this behaviour. Rather than a clean sector rotation, the move resembles the same dispersion trades that dominated markets ahead of major technology earnings.
Bond markets are reinforcing this uneasy backdrop. The US 30-year Treasury yield edged back toward 4.9%, once again testing the upper boundary that has capped yields for weeks.
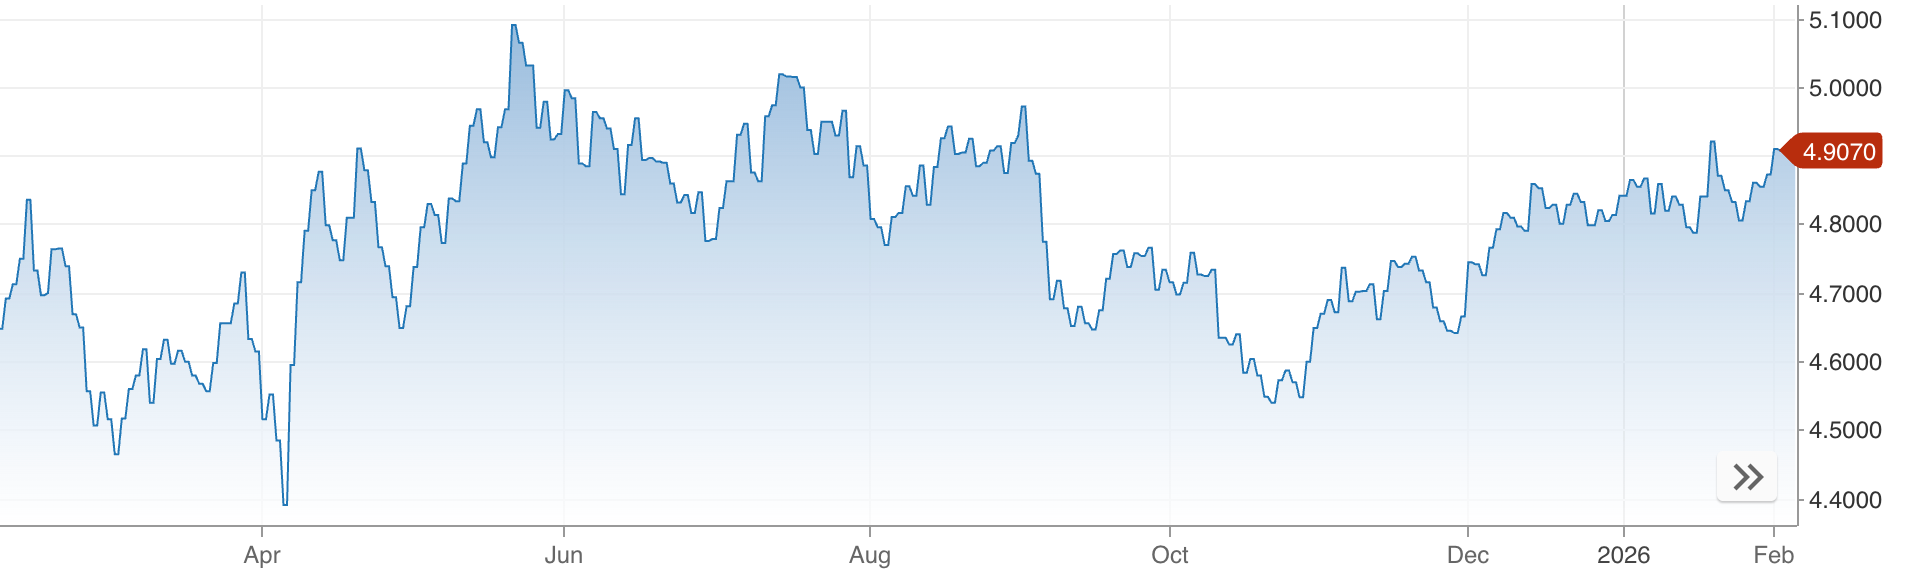
Under normal circumstances, heavy issuance, persistent deficits, and resilient growth would have pushed yields decisively higher. Instead, rates appear frozen, suggesting that liquidity constraints - not optimism - are anchoring markets in place.
Why it matters
For investors, this divergence is a warning sign. When the S&P 500’s surface stability masks internal stress, markets become more vulnerable to abrupt repricing. Equal-weight strength alongside cap-weighted weakness suggests selective risk reduction rather than broad confidence in future growth.
Liquidity dynamics amplify this risk. The US Treasury has signalled that the Treasury General Account could exceed $1 trillion around tax season, implying roughly $150 billion in additional cash being pulled from markets.
While increased Treasury bill issuance may soften the impact, analysts broadly agree it will not fully offset the drain. As Sonali Basak of iCapital noted, markets are not pricing in a shock, but “liquidity is no longer providing the same support it did last year”.
Impact on markets and investors
The most immediate effect has been aggressive sector rotation. Technology, particularly software, bore the brunt of Wednesday’s sell-off as concerns over AI disruption and stretched valuations prompted investors to cut exposure. The Nasdaq Composite fell 1.5%, while the Dow Jones Industrial Average gained 0.5%, underscoring how uneven leadership has become.
At the same time, the longer-term AI narrative remains intact. Alphabet’s earnings highlighted plans to lift capital expenditure to as much as $185 billion by 2026, boosting Nvidia and Broadcom even as Alphabet shares slipped. The market response suggests investors are reassessing near-term pricing rather than abandoning the AI theme outright
For longer-term investors, the risk lies in complacency. If liquidity continues to tighten while rates remain pinned near resistance, volatility could return abruptly once correlations rise and dispersion trades unwind.
Expert outlook
Looking ahead, many strategists expect market dispersion to fade as earnings season ends and tactical positions are unwound. Historically, correlations rise once earnings uncertainty passes, pulling sector performance back into alignment. That process alone could increase volatility, even without a macro shock.
The bigger unknown is liquidity. Weekly jobless claims, Amazon’s earnings, and updates on Treasury funding will be closely watched. A sustained break above 5% in the 30-year yield would likely pressure equity valuations, while continued rate stagnation may signal deeper stress in funding markets. For now, the S&P 500 can absorb tighter liquidity - but only while confidence holds.
Key takeaway
The S&P 500 can withstand tighter liquidity for now, but the margin for safety is shrinking. Divergence within the index, stubborn bond yields, and looming cash drains suggest stability may prove deceptive. As earnings fade from focus, liquidity will take centre stage. The next decisive move will likely come not from profits, but from funding conditions.


