Gold’s reversion to the mean: A pause before the next rally?

Gold has climbed back above $4,050 per ounce, stabilising after a sharp two-week selloff that pulled the metal down from record highs. The move reflects what analysts increasingly describe as a reversion to the mean - a natural correction following a steep run from $3,450 to $4,380 earlier in the quarter.
With the long-delayed US Non-Farm Payrolls (NFP) report now in focus, traders are watching whether this consolidation is a breather before the next leg up. The broader backdrop remains tense. Hawkish Federal Reserve remarks, delayed data from the US government shutdown, and continued geopolitical stress are all reshaping sentiment. Yet, behind the noise, gold’s pullback looks less like weakness - and more like equilibrium returning.
What’s driving gold’s mean reversion
The latest correction follows months of relentless buying, fuelled by soft US data, de-dollarisation flows, and record central-bank accumulation. Gold’s sprint from $3,450 to $4,380 outpaced fundamentals, leaving technical indicators stretched and sentiment euphoric.
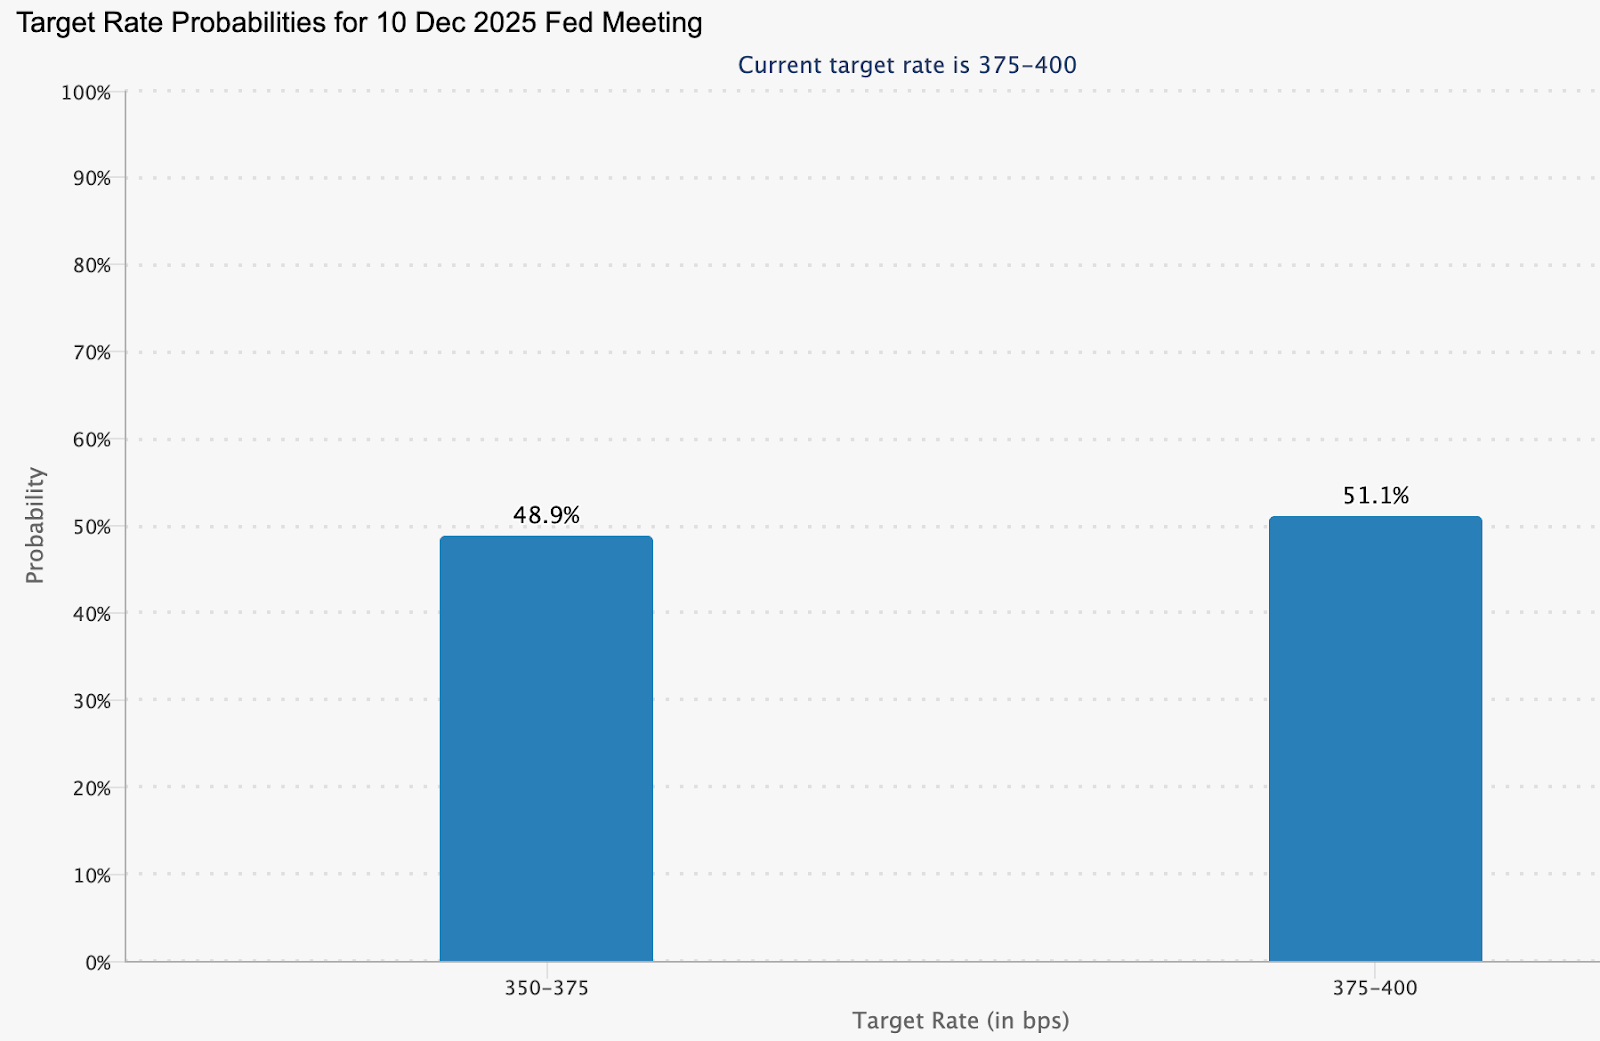
Now, as traders recalibrate expectations for a December rate cut - pricing in a 48.9% chance according to CME FedWatch - the metal has slipped back toward its midrange, around $4,050–$4,100, where short-term and long-term averages converge.
This retreat also mirrors a psychological reset. Markets are digesting the Fed’s cautious tone, with Vice Chair Philip Jefferson urging a “slow approach” to policy changes and regional presidents Bostic and Schmid signalling preference for steady rates. Those comments, paired with delayed macro data, have thinned speculative positions and allowed gold to breathe. In effect, the market is rediscovering balance - a hallmark of mean reversion after an overextended move.
Why it matters
Gold’s mean reversion tells a deeper story about trust and monetary fatigue. As Citadel’s Ken Griffin noted, the rising price of gold reflects “a loss of trust first in US Treasuries, then in G7 bond markets.” Investors are responding not to short-term volatility, but to structural concerns about government debt and the stability of fiat currency.
Analysts at Deutsche Bank maintain that the medium-term trend remains intact, projecting an average gold price of $4,000 per ounce next year. They highlight “elevated official demand” - a reference to sustained central-bank buying.
In October, China’s central bank added 0.9 tonnes to its reserves, marking its 12th straight month of accumulation. Ongoing purchases throughout 2025 have lifted China’s official gold reserves to 2,304.5 tonnes.
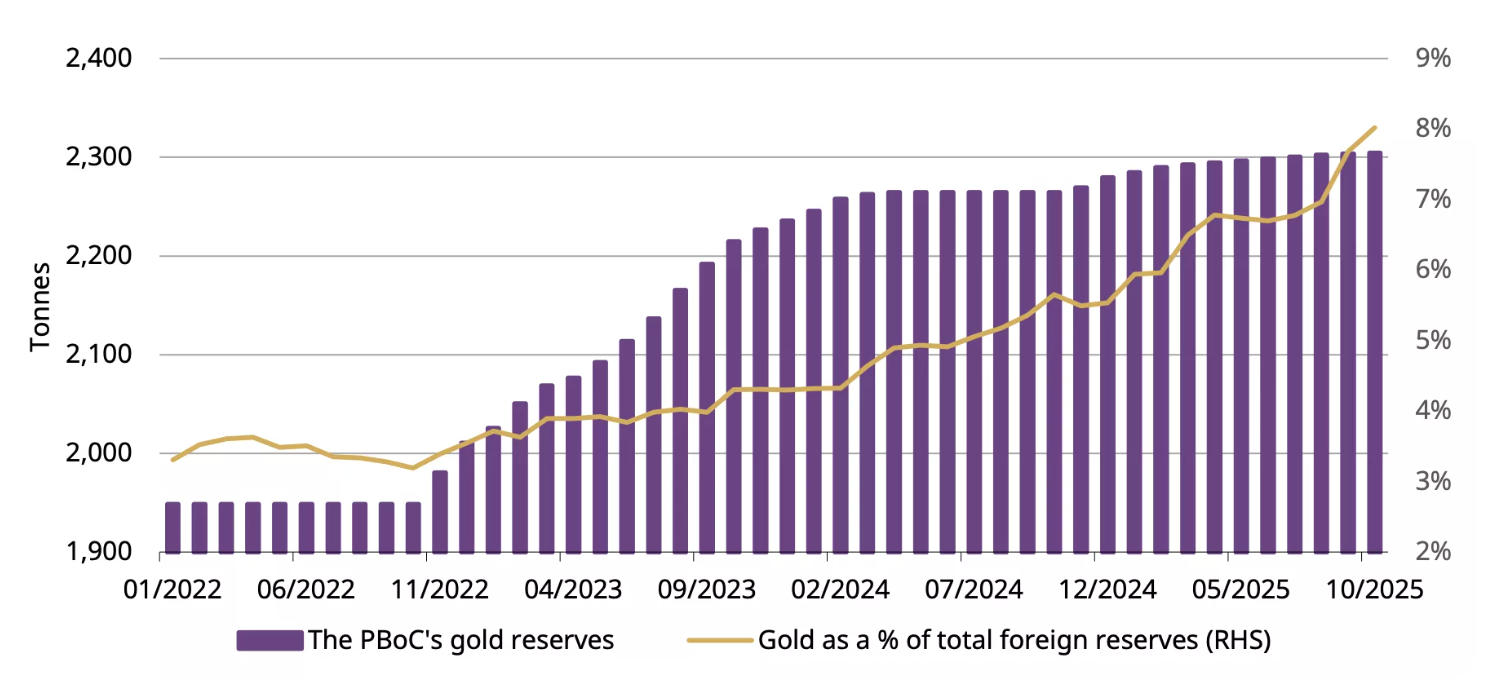
This underlines that while traders may be reverting to the mean, nations are not - they’re steadily diversifying away from the dollar.
Impact across markets
In China, investor appetite for gold remains vigorous even during the correction. ETF inflows jumped RMB 32 billion (US$4.5 billion) in October, pushing total holdings to a record 227 tonnes.
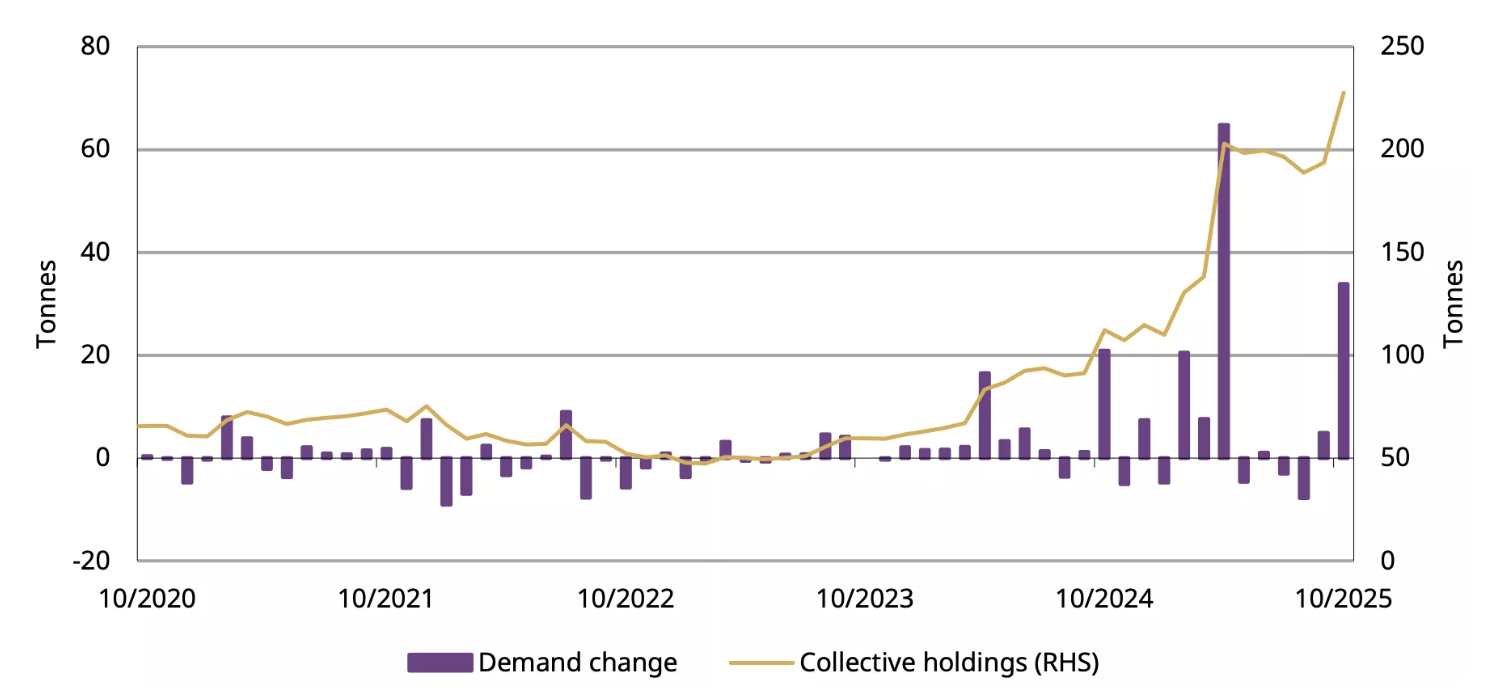
Physical demand, measured by withdrawals from the Shanghai Gold Exchange, rose 17 tonnes year-on-year to 124 tonnes, defying seasonal softness. The data suggests that investors see dips as opportunities, not red flags.
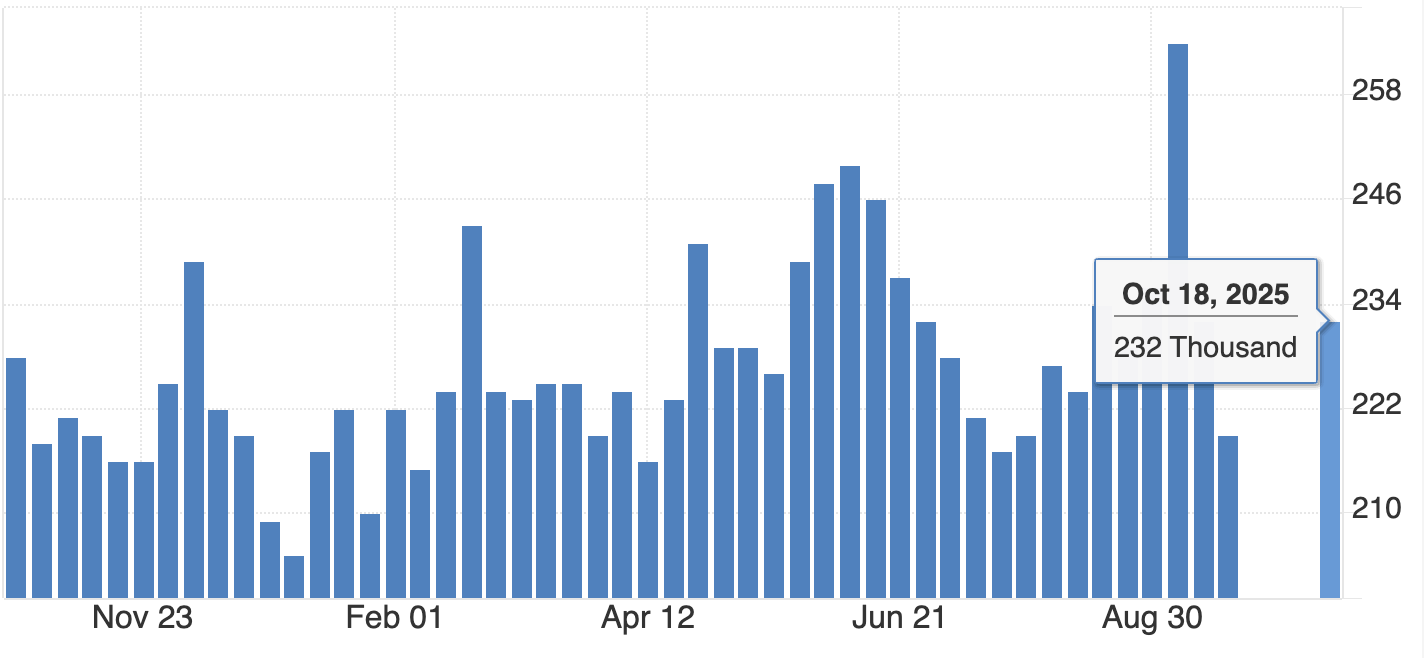
Globally, the story is similar. Soft US employment data and climbing jobless claims have tempered the dollar’s strength, nudging investors back into gold and silver.
Still, there’s awareness that a stronger NFP print or easing geopolitical risk could stall momentum. Even so, mean reversion isn’t a bearish event - it’s the market’s way of restoring order after a speculative sprint. And order, in uncertain times, is the most bullish foundation of all.
Expert outlook
Most analysts agree that gold’s medium-term trajectory remains higher, although near-term volatility will hinge on the US jobs data and the Fed’s stance in December. Independent trader Tai Wong says, “soft data is slightly boosting hopes for a December cut - helping gold and silver, which are trying to break a three-day losing streak.” That sentiment captures the current equilibrium: cautious optimism tempered by macro prudence.
If the NFP report underperforms, gold could swiftly retest $4,200, according to analysts. If it surprises to the upside, a dip toward $3,950 would complete a textbook mean reversion cycle before stabilising. Either way, the long-term bull case - driven by de-dollarisation, AI-driven labour disruption, and inflation inertia - remains intact. The question isn’t whether gold rises again, but when.
Gold technical analysis
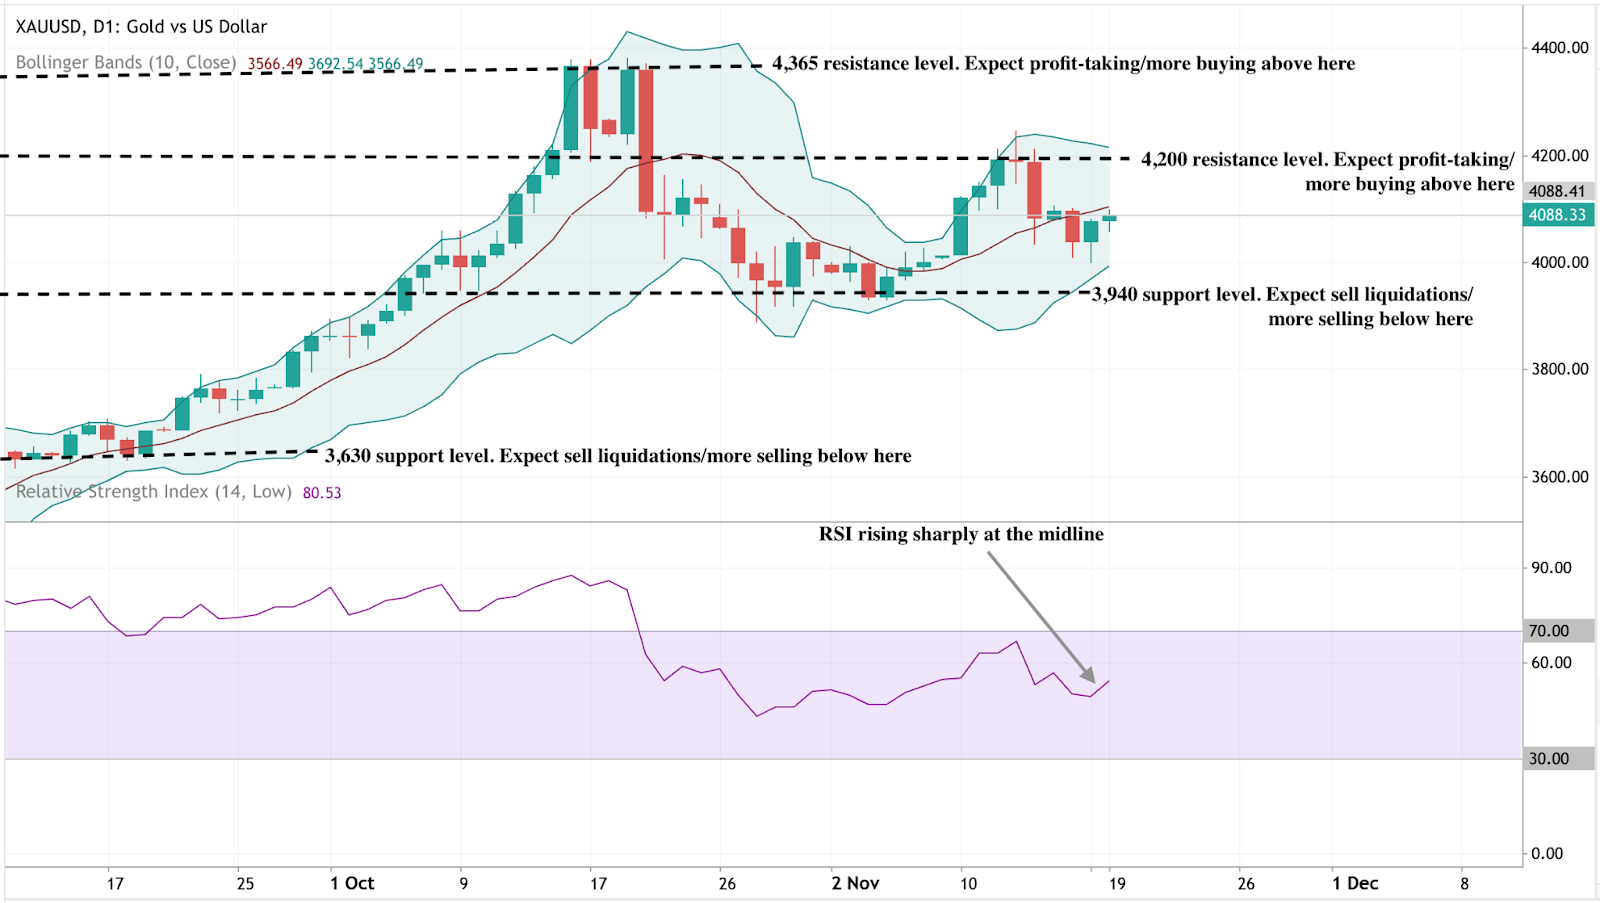
At the time of writing, XAU/USD is trading near $4,088, rebounding from the lower Bollinger Band as buyers re-enter the market. The Bollinger Bands are beginning to widen after a period of contraction, suggesting that volatility may be returning.
The RSI is rising sharply from the midline, signalling improving bullish momentum. Key resistance levels are seen at $4,200 and $4,365, where profit-taking or further buying could occur if gold breaks higher. On the downside, a fall below $3,940 would likely trigger sell liquidations, exposing deeper support at $3,630.
Overall, gold appears to be in the early stages of a potential bullish continuation, with the technical setup hinting at renewed upside pressure if momentum sustains above the mid-Bollinger Band.
Key takeaway
Gold’s pullback to the $4,000 zone isn’t weakness - it’s rhythm. A reversion to the mean after a parabolic rise is how sustainable trends reset. Beneath short-term volatility, the drivers of this bull phase - de-dollarisation, central-bank accumulation, and macro distrust - remain fully in play. As the US jobs data and Fed decisions unfold, this pause could mark the quiet before gold’s next major rally.
The performance figures quoted are not a guarantee of future performance.


