Gümüş, tarihi rallide volatiliteyle Nvidia'yı geride bıraktı
.png)
Gümüş nadiren sessiz hareket eder, ancak son yükselişi piyasa manzarasını yeniden şekillendirdi. Metal, yıl başından bu yana %185'ten fazla artış göstererek kısa bir süreliğine ons başına 84 doların üzerine çıktı ve tahmini piyasa değerini 4,65 trilyon dolara taşıdı. Böylece Nvidia'yı geride bırakarak değer açısından dünyanın en büyük ikinci varlığı oldu. Bu hareket, gümüşün 1979'dan bu yana en güçlü yıllık performansını işaret ediyor; o yıl, enflasyon şokları ve emtia çalkantılarıyla piyasa tarihine kazınmıştı.
Sonrasında yaşananlar, gümüşün ününü bir kez daha hatırlattı. Vadeli işlemlerin yeniden açılmasından biraz fazla bir saat sonra fiyatlar sert dalgalandı, neredeyse %10 değer kaybettikten sonra 75 dolar civarında dengelendi. Bu ani dalgalanma şimdi daha büyük bir sorunun merkezinde: Gümüş, yapısal olarak desteklenen bir boğa piyasasına mı giriyor, yoksa kaldıraç ve volatilitenin sonunda temelleri gölgede bıraktığı tanıdık bir döngüyü mü tekrar ediyor?
Gümüşün tarihi yükselişini ne tetikliyor?
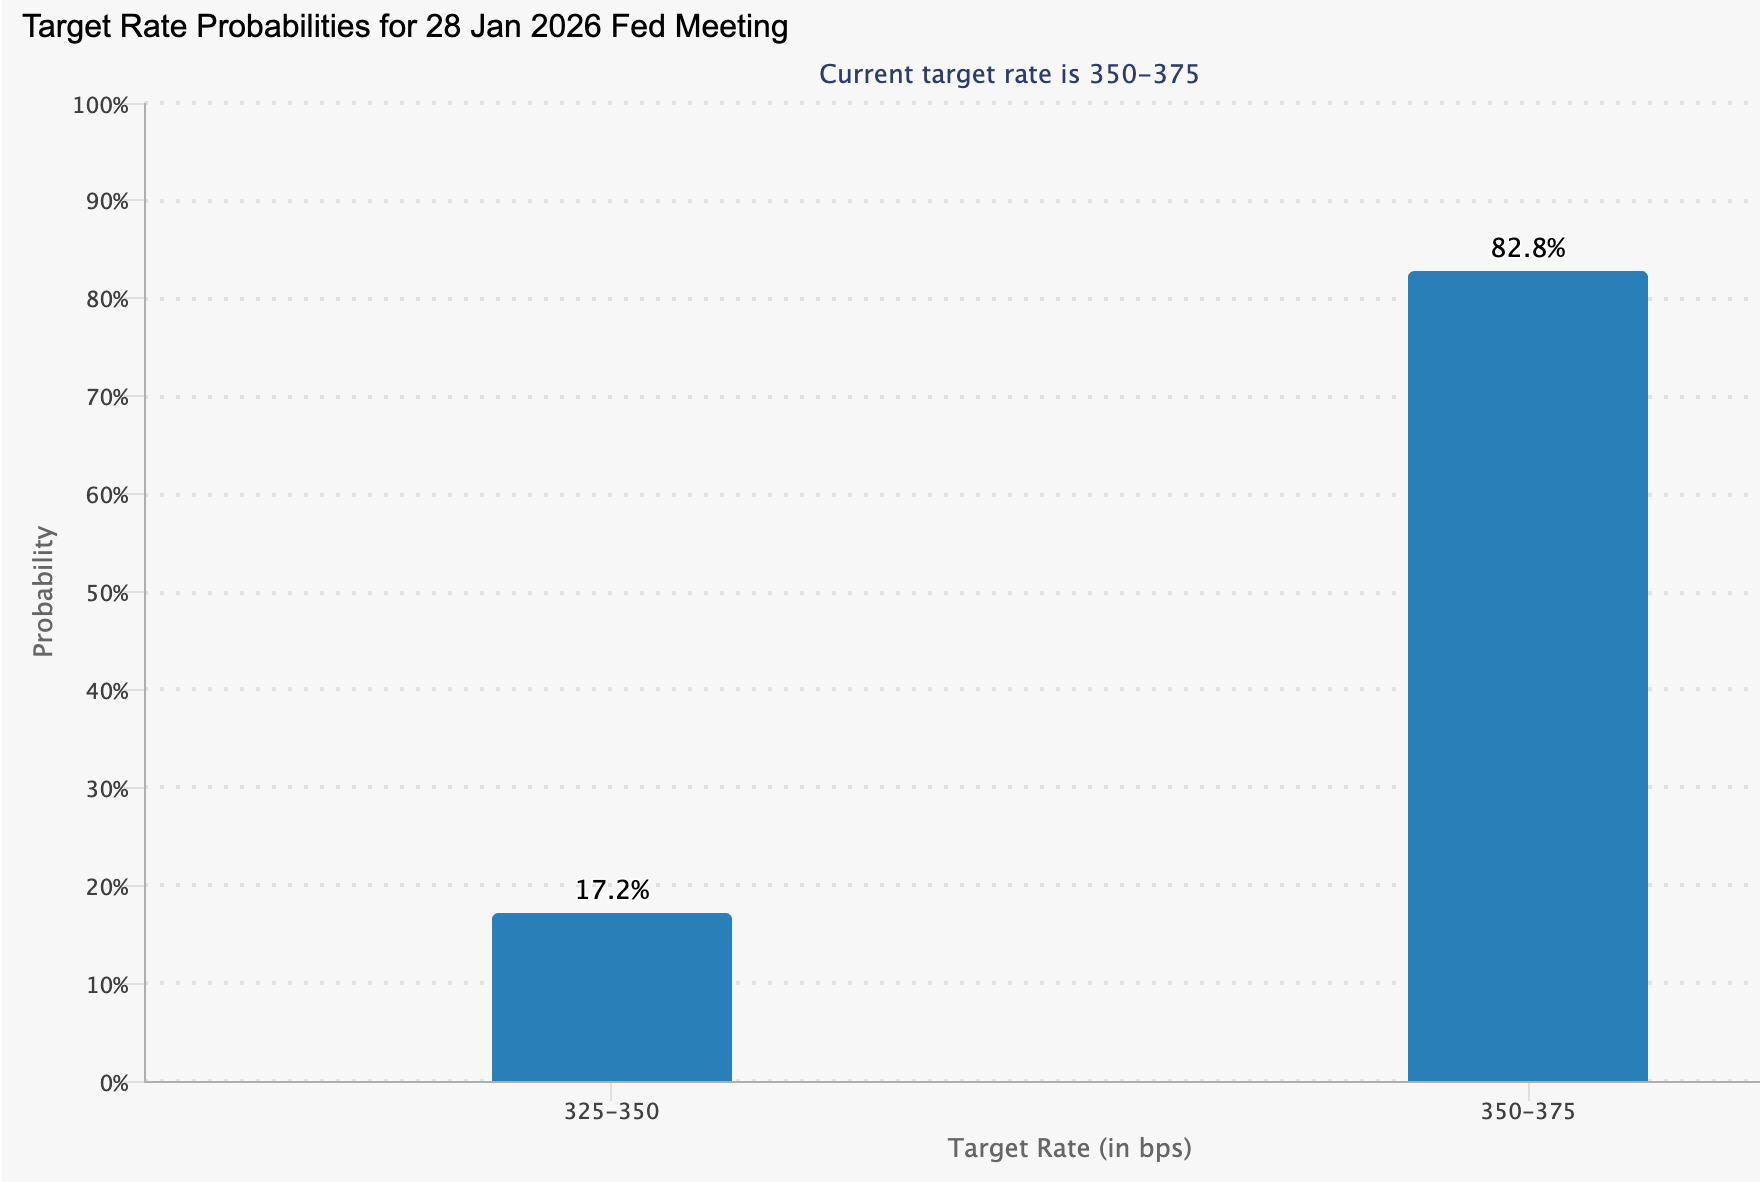
Gümüşteki çıkış, spekülatif coşkudan fazlasını yansıtıyor. ABD Federal Reserve'ün 2026'da daha derin faiz indirimleri yapacağı beklentileri, CME FedWatch aracının bir sonraki Ocak toplantısında faizlerin değişmeden kalma olasılığını %82,8 olarak göstermesine rağmen, reel varlıklara olan talebi yeniden canlandırdı.
Düşük reel getiriler tarihsel olarak değerli metalleri desteklemiş olsa da, gümüş bu eğilimi daha da güçlendirdi; hem parasal bir koruma aracı hem de endüstriyel bir girdi olarak çift rolünden fayda sağladı.
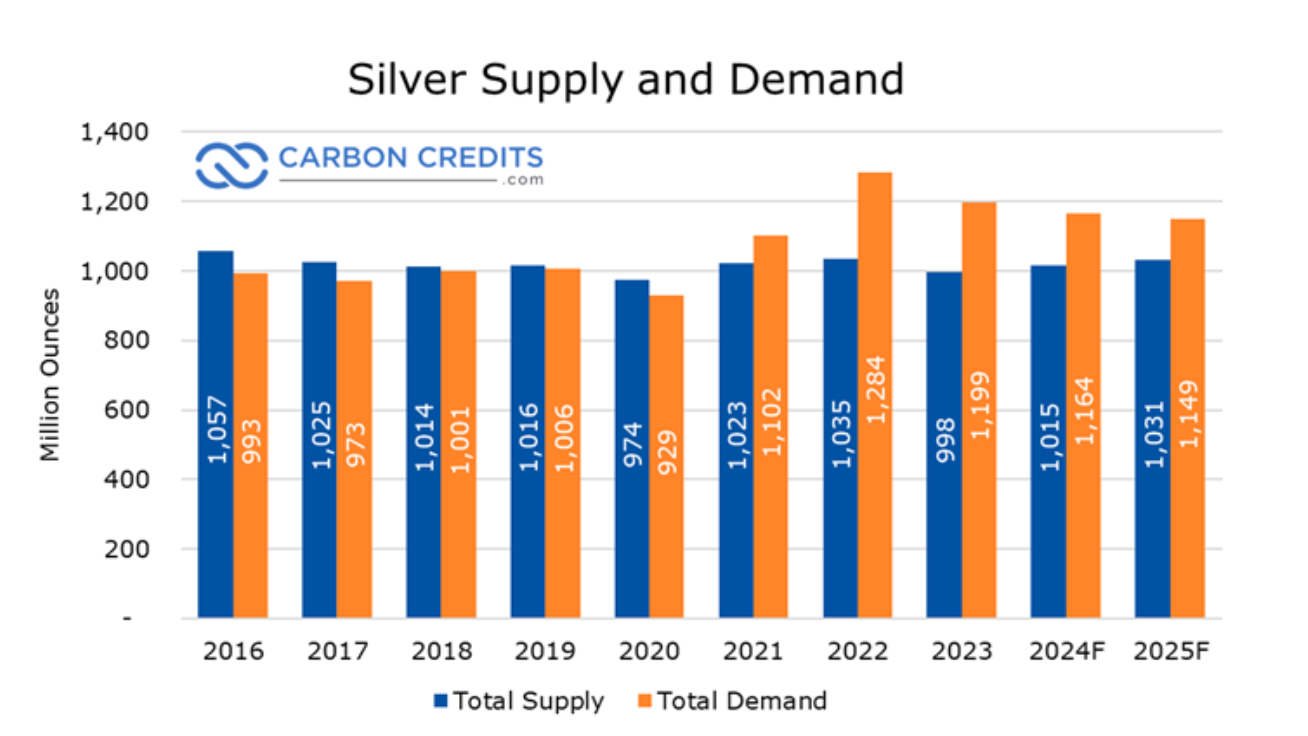
Bu makro arka planın altında ise yıllardır biriken bir arz dengesizliği yatıyor. 2025'in, küresel gümüş talebinin arzı üst üste beşinci kez aşacağı yıl olması bekleniyor; bu da piyasayı döngüsel sıkılıktan yapısal açığa kaydırıyor.
Sektör tahminlerine göre, bu yıl küresel talep yaklaşık 1,12 milyar ons seviyesinde, arz ise yaklaşık 1,03 milyar ons; bu da yıllık yaklaşık 95 milyon ons açık anlamına geliyor. 2021'den bu yana kümülatif açıkların yaklaşık 800 milyon ons olduğu tahmin ediliyor; bu da neredeyse bir yıllık küresel maden üretimine eşdeğer. Bu fark, büyük merkezlerdeki stokların eritilmesiyle kapatıldı ve piyasanın şok emicisi giderek zayıfladı.
Arz tarafı, artan fiyatlara rağmen yanıt vermekte zorlanıyor. 2025'te maden üretiminin yaklaşık 813 milyon ons olacağı ve yıllık bazda genel olarak sabit kalacağı tahmin ediliyor.
Küresel gümüş üretiminin yaklaşık üçte ikisi, bakır, çinko ve kurşun gibi metallerin madenciliği sırasında yan ürün olarak elde ediliyor; bu da arzın gümüşe özgü fiyat sinyallerine ne kadar hızlı tepki verebileceğini sınırlıyor. Geri dönüşüm ise yalnızca marjinal bir rahatlama sağlıyor; ikincil arz yaklaşık %1 artarken, açığı kapatmak için gerekenin çok altında kalıyor. Pratikte, sıkılaşan talep stoklar ve vadeli işlemler piyasası üzerinden iletiliyor ve pozisyon değişikliklerinde volatiliteyi artırıyor.
Politika riski de ek bir baskı oluşturdu. Pekin, 1 Ocak 2026'dan itibaren gümüş ihracatçılarının devlet lisansı almasını zorunlu kıldığını doğruladı; bu da yurtdışı satışları büyük, devlet onaylı üreticilerle sınırlıyor. Çin'in küresel rafine gümüş kapasitesinin %60–70'ini kontrol ettiği düşünüldüğünde, mütevazı ihracat kısıtlamaları bile fiziksel erişilebilirlik açısından büyük sonuçlar doğurabilir. Bu risk primi, fiyatların keskin şekilde yükselmesine yardımcı olurken, piyasayı ani duygu değişimlerine karşı daha hassas hale getirdi.
Neden önemli?
Gümüşteki ralli, emtia ticaret masalarının çok ötesinde sonuçlar doğuruyor. Altından farklı olarak, gümüş modern endüstriye derinlemesine entegre; elektrifikasyon ve güneş panellerinden elektrikli araçlara ve veri merkezlerine kadar. Bu çift kimlik, yükselişin sanayi liderlerinden uyarılar almasının nedenini açıklıyor. Tesla CEO'su Elon Musk, gümüş fiyatlarındaki artışı "iyi değil" olarak nitelendirerek metalin çok çeşitli üretim süreçlerindeki önemine dikkat çekti.
Analistler, bu hareketin sürdürülebilir olup olmadığı konusunda bölünmüş durumda. IG'den piyasa analisti Tony Sycamore, değerli metallere sermaye akışının gerçek arz stresiyle çarpışmasıyla potansiyel bir "nesil balonu" oluşabileceği uyarısında bulundu. Ona göre, fiziksel gümüşe olan talep kendi kendini besler hale geldi ve fiyatları kısa vadeli endüstriyel talebin haklı gösterebileceği seviyelerden uzaklaştırdı.
Bu gerilim önemli, çünkü gümüşün fiyatı finansal spekülasyon ile gerçek üretim maliyetlerinin kesişiminde yer alıyor. Aşırı hareketler, piyasanın her iki tarafını da bozma riski taşıyor.
Sanayi ve piyasalara etkisi
Sektör açısından, kalıcı yüksek fiyatların sonuçları var. Güneş paneli üretimi artık yıllık gümüş tüketiminin önemli bir bölümünü oluşturuyor ve elektrikli araçlar, içten yanmalı motorlara göre çok daha fazla gümüş gerektiriyor. Analistler, ons başına 130 dolara yaklaşan fiyatların güneş enerjisi sektöründe faaliyet marjlarını aşındıracağını ve küresel yenilenebilir hedeflerin hızlandığı bir dönemde benimsemeyi yavaşlatabileceğini tahmin ediyor.
Finansal piyasalar ise farklı bir stres noktasıyla karşı karşıya. Chicago Mercantile Exchange, iki hafta içinde ikinci kez gümüş marjını artırdığını açıkladı ve Mart 2026 kontratlarında ilk teminat gereksinimini yaklaşık 25.000 dolara yükseltti. Bu hamle, volatilite artarken kaldıraçlı yatırımcılar üzerindeki baskıyı artırıyor.
Tarih arka planda kendini hissettiriyor. 2011'de, bir dizi hızlı marj artışı gümüşün 50 dolara yakın zirveye ulaşmasıyla aynı zamana denk geldi ve zorunlu kaldıraç azaltımı ile keskin bir düzeltmeyi tetikledi. 1980'de ise düzenleyici müdahale ve agresif faiz artışları, yüksek kaldıraçlı bir ralliyi ezdi. Bugünkü önlemler o kadar aşırı olmasa da, analistler kaldıraçta ılımlı azalmaların bile kısa vadede fiziksel alımları gölgede bırakabileceği konusunda uyarıyor.
Uzman görüşü
Kısa vadeli görünüm, fiziksel talebin vadeli işlemlerdeki zorunlu satışları absorbe edip edemeyeceğine bağlı. COMEX stoklarının son beş yılda yaklaşık %70 azaldığı, Çin'in yerel gümüş stoklarının ise on yılın en düşük seviyelerine yakın olduğu bildiriliyor. Derin negatif gümüş swap oranları, alıcıların giderek daha fazla gerçek teslimat talep ettiğini, kağıt pozisyonlara ilginin azaldığını gösteriyor.
Riskler yüksek kalmaya devam ediyor. Hedge fonlar yıl sonu portföy dengelemesiyle karşı karşıya, emtia endeksi ayarlamaları yaklaşıyor ve jeopolitik manşetler değişkenliğini koruyor. 75 doların altına kalıcı bir kırılma, daha derin bir konsolidasyon evresinin sinyalini verebilirken, fiziksel piyasalarda yeniden stres oluşması yukarı yönlü ivmeyi hızla canlandırabilir.
Şimdilik, gümüş yapısal kıtlık ile finansal kaldıraç arasındaki kavşakta duruyor. Önümüzdeki seanslar, bu tarihi rallinin daha uzun vadeli bir yeniden fiyatlamaya mı dönüşeceğini, yoksa kendi volatilitesinin ağırlığı altında mı kırılacağını belirleyecek.
Öne çıkan sonuç
Gümüşün Nvidia'yı geride bırakması, spekülatif aşırılıktan fazlasını işaret ediyor. Çok yıllık yapısal arz açığı, sıkılaşan stoklar ve artan endüstriyel talep, kaldıraçlı piyasalarla çarpıştı. Marj artışları ve jeopolitik değişimler keskin düzeltmelere yol açabilir, ancak altta yatan kıtlık hikayesi çözülmemiş görünüyor. Yatırımcılar, gümüş en kritik evresine girerken fiziksel stokları, Çin'in politika sinyallerini ve vadeli işlemler piyasasındaki pozisyonlanmayı yakından izlemeyi düşünebilir.
Gümüş teknik görünüm
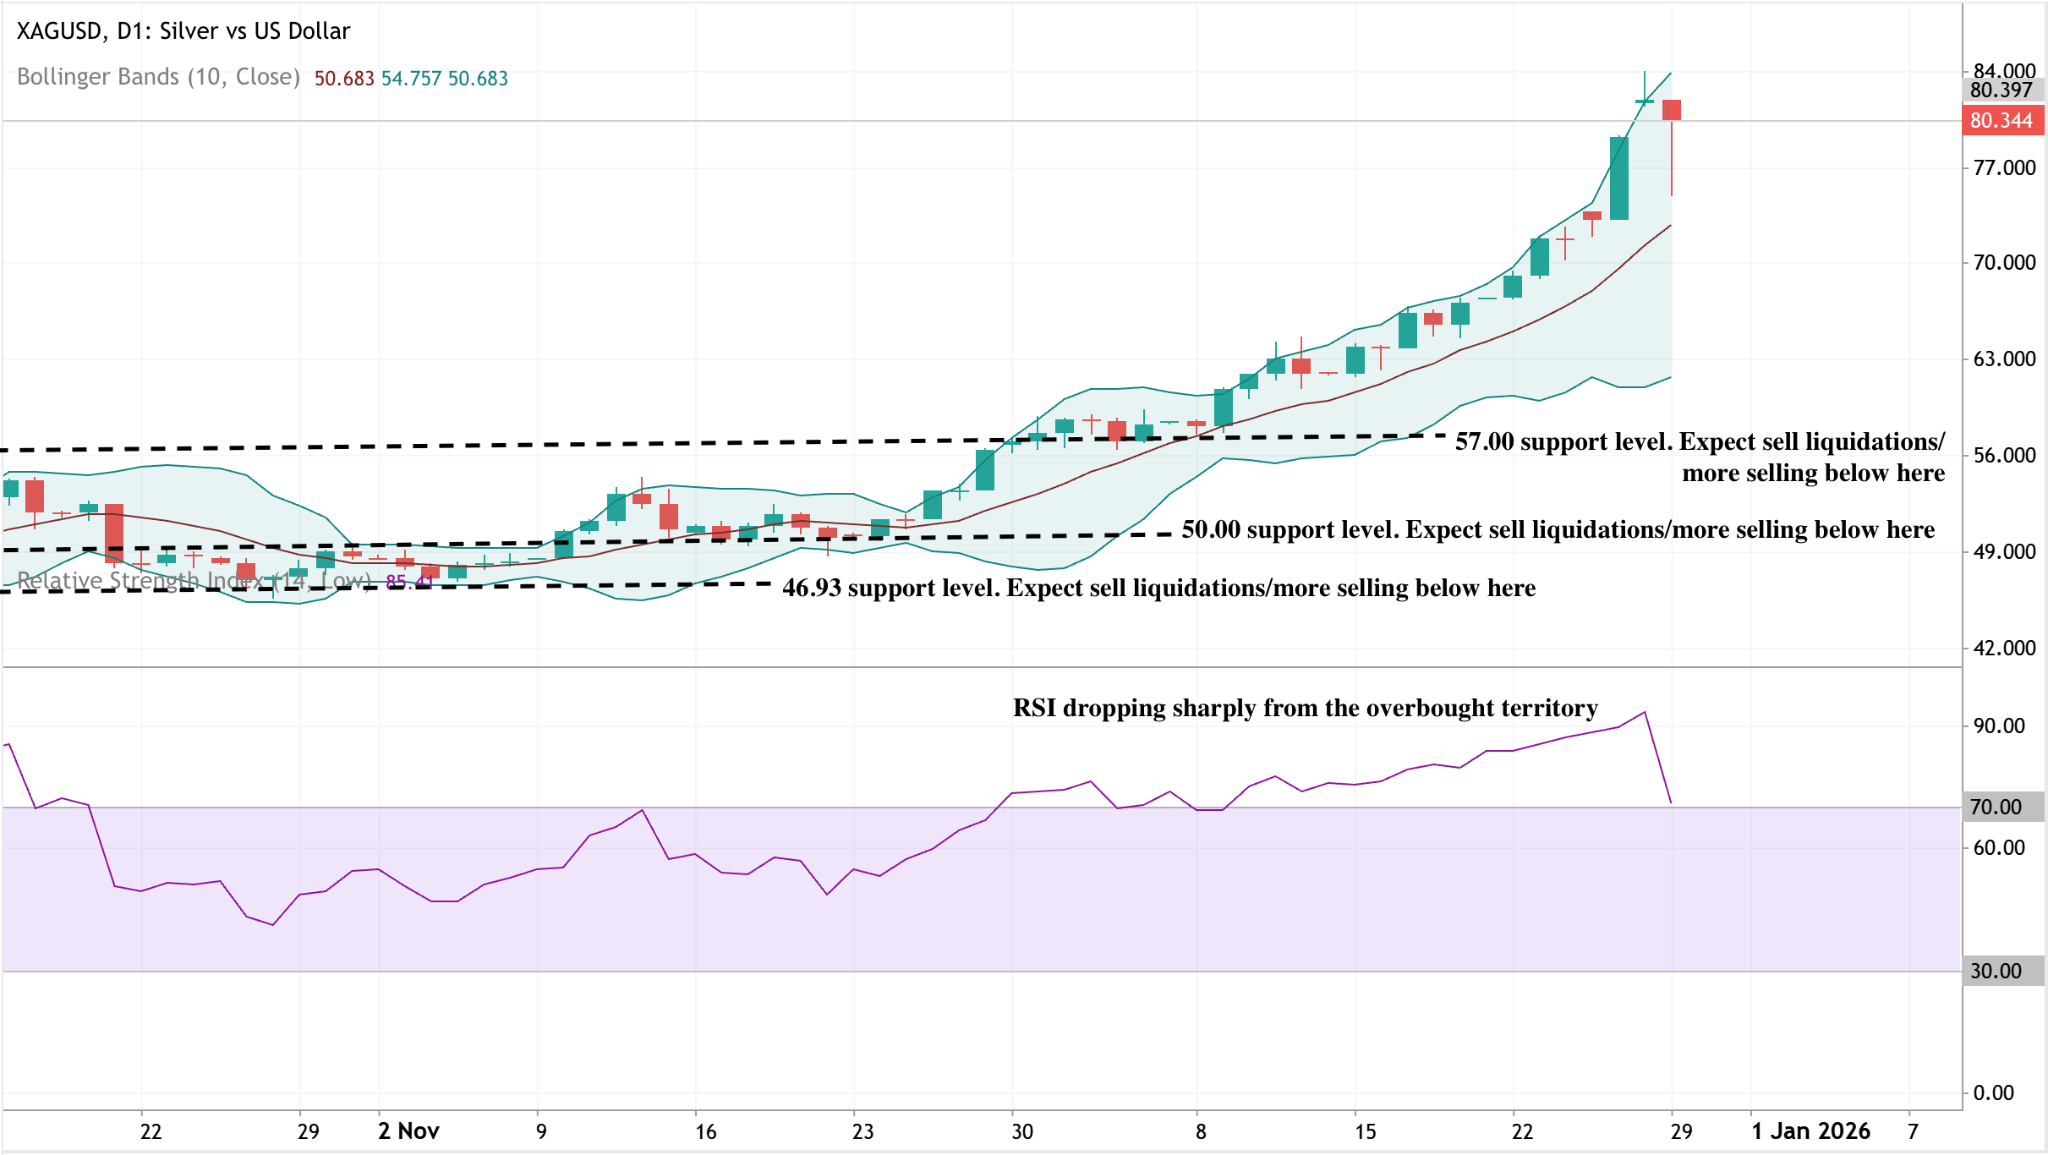
Gümüş, üst Bollinger Band üzerinde agresif bir şekilde yükseldikten sonra sert bir geri çekilme yaşadı ve yukarı yönlü ivmenin aşırıya kaçtığını gösterdi. Fiyat yüksek kalmaya devam ediyor, ancak son reddedilme, uzun süren bir rallinin ardından kısa vadeli kar realizasyonuna işaret ediyor.
Aşağıda, 57,00$ ilk önemli destek, ardından 50,00$ ve 46,93$ geliyor. Fiyatın Bollinger orta bandına doğru kalıcı bir hareketi, daha derin bir düzeltme riskini artıracaktır. Momentum soğuyor; RSI aşırı alım bölgesinden keskin şekilde düşerek konsolidasyonun, ani trend devamından daha olası olduğunu gösteriyor.
Belirtilen performans rakamları, gelecekteki performans için bir garanti değildir.


