How can you trade commodity currency pairs in forex trading?

Commodity-linked currencies often mirror shifts in global markets, but the relationships are fluid rather than fixed. Traders who follow a drift-aware, event-driven approach aim to understand how changing commodity prices, macroeconomic conditions, and policy expectations combine to shape movements in pairs such as AUD/USD, USD/CAD, and NZD/USD.
This article explains how to trade these pairs effectively using a structured, lens-based framework that balances technical execution with contextual awareness.
Quick summary
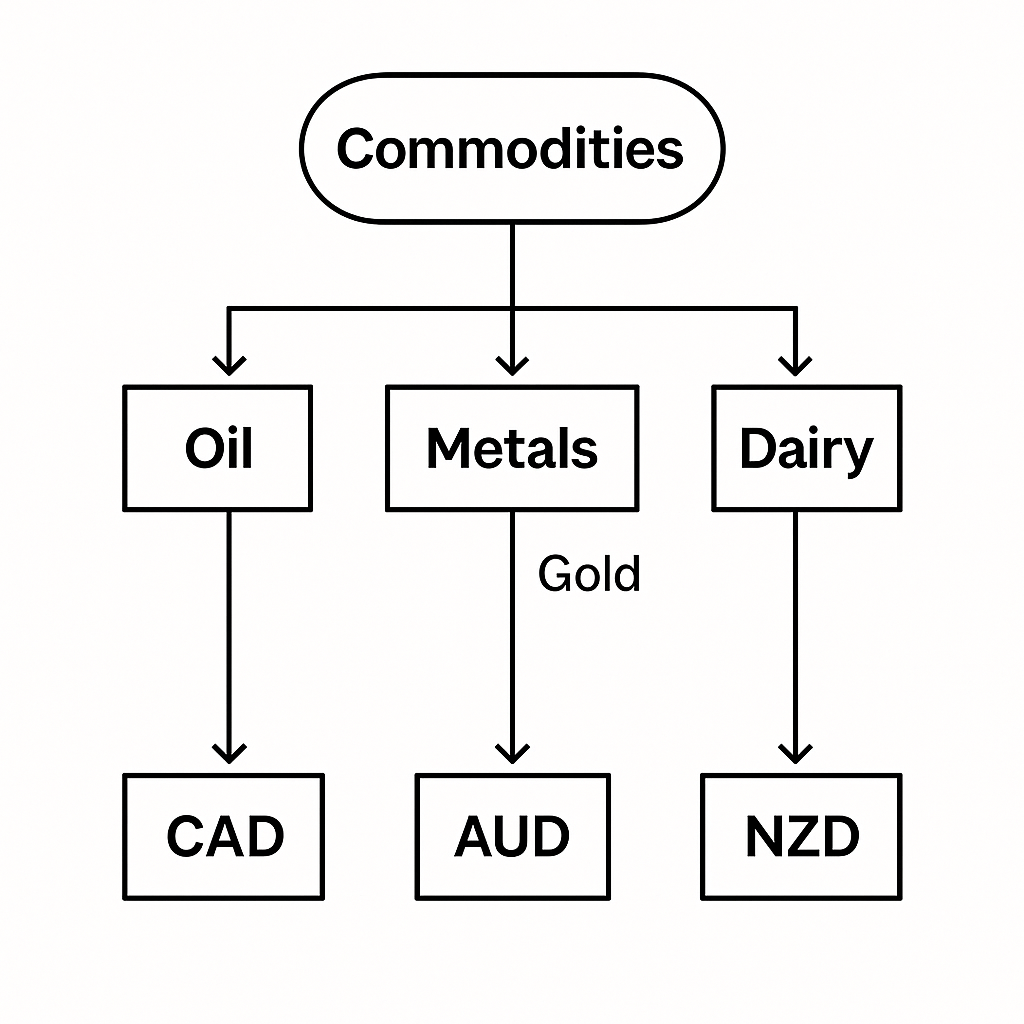
- Commodity links (oil→CAD, metals/gold→AUD, dairy→NZD) are real but change with time—use them as context, not fixed rules.
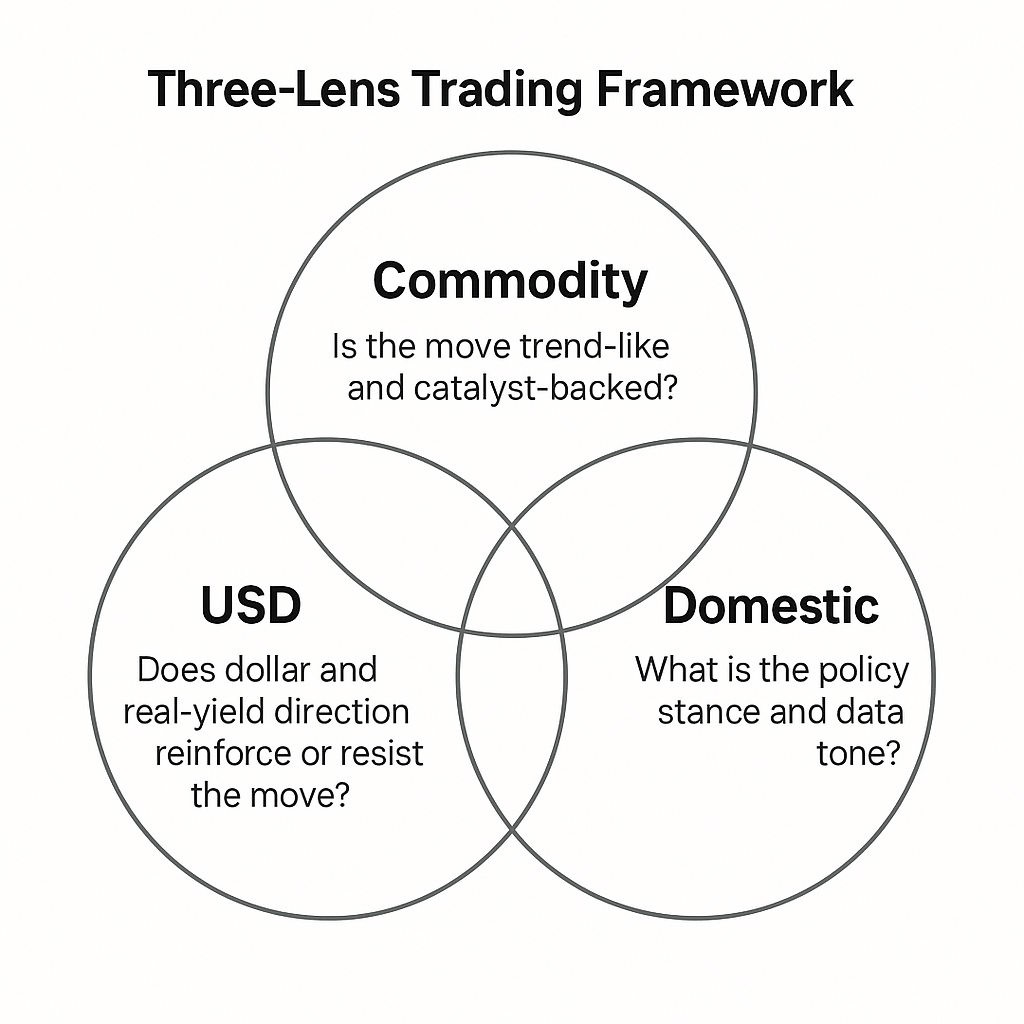
- Apply a Three-lens Model: Commodity trend/catalyst, USD backdrop, and domestic policy/data.
- Trade only on confluence; plan around events; scale size to correlation stability; confirm divergence moves before entry.
- Define invalidation in advance for inventories, auctions, and central-bank days.
- As with all forex trading, these approaches involve market risk and no outcome is guaranteed.
What does forex trading with commodity currency pairs look like day to day?
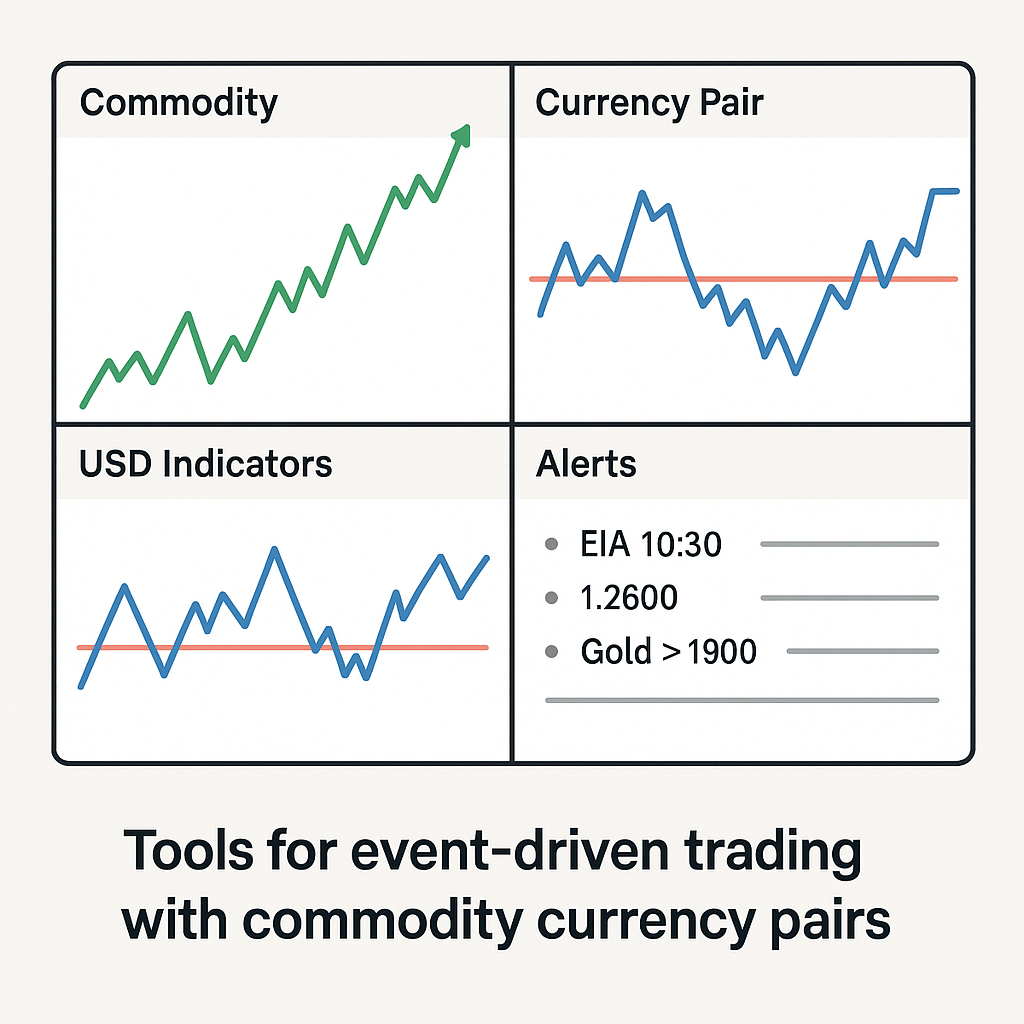
A session starts with a prepared calendar and linked charts: oil or metals on one screen, the related FX pair on another, and the dollar index or yields nearby. Watchlists track EIA inventories, OPEC+ meetings, RBA/BoC/RBNZ decisions, China PMIs, and GDT auctions. Alerts trigger at price levels or event times.
During the day, seek confluence.
“In commodity FX, the first signal is rarely the best signal. The edge comes from waiting for the story and the structure to align.” — Deriv Analyst Team
Example for beginners
If crude oil rises steadily for several days while Canada posts stronger-than-expected employment data, USD/CAD often drifts lower. A beginner-focused approach is to wait for a clearer chart structure, such as a break and retest, which can help impose discipline on the trade setup, while recognising that market outcomes remain uncertain and price can still move against the position.
If crude prints a third draw, yields soften, and Canada data hold firm, expect USD/CAD to lean lower, but wait for structure (break and retest) before entry. Size the trade according to how stable the week’s commodity–FX link looks. If signals conflict, say oil rises but the dollar strengthens, reduce size or shift to a cross where the tension is smaller.
Execution should be structured and disciplined. Stage orders where you can exit fast if wrong. Stops sit beyond invalidation levels, not arbitrary pips; exits scale out at prior swing points. Post-trade, a short journal entry notes catalyst, lens scores, and result, which is useful for spotting early regime shifts.
What are commodity currency pairs in forex trading, and which pairs like USD/CAD, AUD/USD, and NZD/USD qualify?
Commodity currency pairs are those where one side belongs to a major commodity-exporting economy. The key trio—AUD/USD, USD/CAD, and NZD/USD—earn that label because metals/gold, oil, and dairy shape their export earnings and, through that, growth, inflation, and interest-rate expectations.
When export prices rise sustainably, national income improves and policy expectations firm, supporting the currency. The reverse holds when prices fall. The link is conditional and regime-dependent—USD direction and domestic policy often override commodity impulses short term.
A practical workflow blends clean commodity and FX data, an event calendar, and a checklist to confirm confluence instead of reacting to a single headline.
“Most correlations are conditional. Treat every commodity–currency link as a regime that must be revalidated, not assumed.” — IMF Research Note
Example for beginners
If iron-ore prices rise overnight and China’s PMI comes in above 50, a trader checks whether AUD/USD is forming higher lows. If the chart supports the macro backdrop, the trader can plan a small, structured long position.
Why do commodity-linked currencies move with commodities, and how does correlation strategy change?
The commodity→FX channel runs through income and policy transmission. Price shocks alter margins, taxes, and spending; these affect growth and inflation, which steer rate paths and bond yields; FX discounts the new outlook.
Correlations drift as regimes shift—OPEC+ actions, mining investment, weather, and inventories all play a role. The USD mechanically lifts or weighs on commodities, while local policy and risk appetite can amplify or offset the effect. Producer hedging sometimes hides the pass-through in spot FX.
Use rolling correlation statistics to identify regimes, not to time entries.
Example for beginners
When dairy prices have been rising for several weeks but NZD/USD hasn’t moved much, it may signal a lag. Instead of entering early, beginners can wait for the pair to break above a repeated resistance level before considering a trade.
Before committing risk, read the tape through three lenses:
- Commodity lens: Is the move trend-like and catalyst-backed (multi-week draws, credible demand shifts)?
- USD lens: Does dollar and real-yield direction reinforce or resist the move?
- Domestic lens: What is the policy stance and data tone (RBA/BoC/RBNZ; CPI, labour, activity)?
Trade only when at least two lenses align, and consider normal position size when all three lenses support the view, while keeping in mind that alignment does not remove the inherent risks present in all market conditions.
Senior FX Strategist at ANZ elaborates:
“Alignment across lenses reduces false positives dramatically. When all three agree, conviction and size can increase safely.”
How should you approach USD/CAD, AUD/USD, and NZD/USD when forex trading commodity currency pairs?
USD/CAD — oil-sensitive, not oil-dominated
Canada’s crude exports make CAD responsive when oil moves for genuine reasons: persistent EIA draws, OPEC+ restraint, or credible supply shocks. Still, U.S. yields and risk sentiment shape day-to-day swings.
In some market conditions, selling USD/CAD rallies near established resistance may offer clearer structure than chasing breakouts, although this still involves market risk and does not guarantee improved outcomes. When oil is firm but the USD rises on risk-off or strong U.S. data, expect range conditions: trade smaller or focus on CAD crosses.
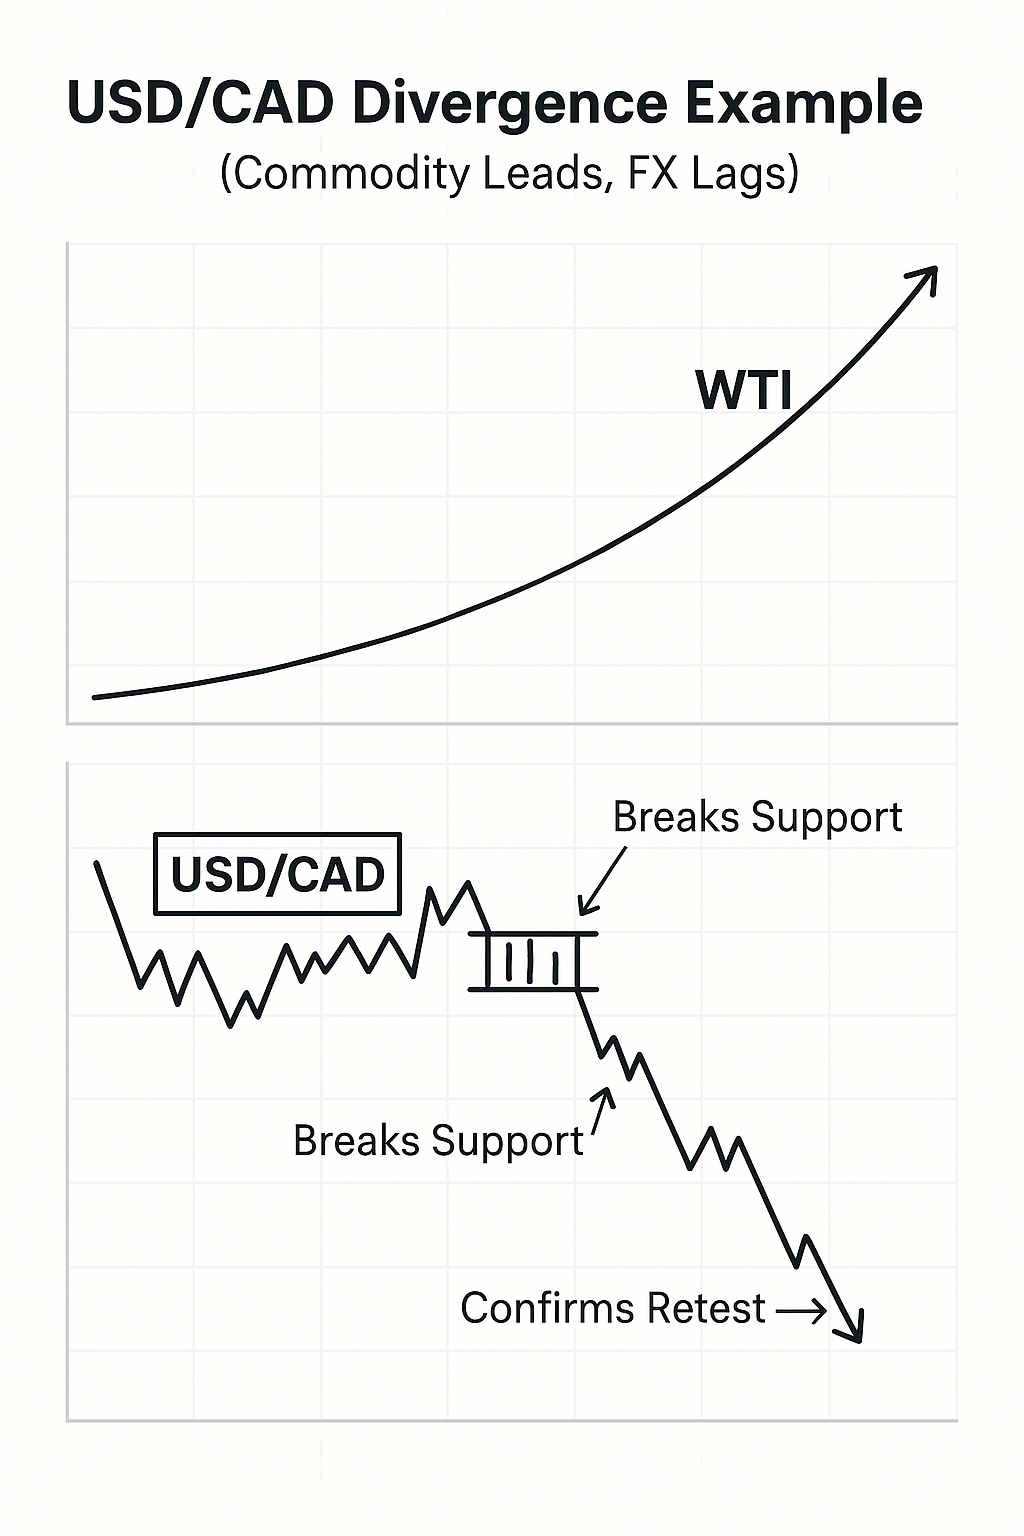
A classic divergence appears when WTI rallies yet USD/CAD stalls below range; the cleaner entry comes on the first retest of broken support from beneath, with stops beyond the invalidation swing. The main spoiler is a sudden USD surge—always keep hard stops and avoid averaging into headlines.
AUD/USD — metals, China, and policy nuance
Australia’s export basket links AUD to iron ore, coal, and gold, while China’s data transmit demand shocks. The cleanest rallies pair firm metals with a softer USD and an RBA that is at least neutral to hawkish.
Pullbacks toward recent value (prior range highs or moving averages) can provide patient entries. If metals are strong but China PMIs are mixed, or the RBA sounds cautious, treat longs as tactical.
A practical sequence: China PMI returns above 50, gold breaks out as real yields fall, and AUD/USD clears a multi-week range. Waiting for the pullback that holds that level offers better risk–reward than buying the first break. Flip bias quickly if the USD turns higher on surprise data or a soft Australia CPI undercuts RBA expectations.
NZD/USD — dairy, weather, and regional beta
Dairy’s weight in exports means GDT results can sway income expectations and policy outlook. NZD also inherits AUD’s regional beta.
A favourable backdrop blends rising GDT prints, firm RBNZ rhetoric, and a neutral-to-weaker USD; in that case, lean long on dips with AUD/NZD strength confirmation. Underperformance shows when dairy softens or RBNZ turns dovish despite global risk-on.
A typical catch-up trade follows two or more strong auctions while NZD/USD stays capped; once U.S. data push the dollar lower and price holds above resistance, the first higher-low above breakout offers clearer levels for placing stops and managing exposure.
Remember, NZD weakens fast in global risk-off. Respect that asymmetry when sizing.
What tools support event-driven trading and risk management for commodity currency pairs?
Linked layouts let you view the commodity and its currency side by side. When oil jumps, you immediately see whether USD/CAD reacts.
Pre-built watchlists group catalysts by pair—EIA and OPEC+ for USD/CAD; RBA, Australia CPI, and China PMIs for AUD/USD; GDT and RBNZ events for NZD/USD—so no release surprises you.
Layer alerts:
- One for economic event times
- One for price levels
- One for conditions (for example, “gold above last week’s high while DXY is down”).
Templates and checklists help consistency: score each lens, define invalidation, and write the if/then before placing the order. Position-sizing tools convert risk into lot size so you know exposure precisely.
Session awareness also matters: AUD/NZD react more in Asia hours; USD/CAD in North American flows. After each trade, journal catalyst, lens score, and result—these notes reveal when regimes shift.
How can a correlation strategy and risk management framework guide trades in commodity currency pairs?
Score each lens +1 / 0 / –1.
- Commodity lens: trend-like and catalyst-backed?
- USD lens: dollar and yield direction supportive?
- Domestic lens: policy stance aligned?
Commit risk only when the total score ≥ +2. If lower, wait or switch to a relative-value trade that reduces the conflicting lens.
Translate the score into a plan:
- Define trigger (for example, “retest of broken support holds”).
- Mark invalidation (where thesis fails).
- Set initial target (nearest swing extreme).
- Plan stop-trailing logic.
Account for calendar risk between entry and exit—trim or hedge around key prints.
How does event-driven trading shape entries, sizing, and exits in commodity currency pairs?
For trend-following, let price break structure, then buy/sell the retest with stops beyond invalidation and staged exits at prior extremes.
For mean reversion, fade only true extensions against a neutral macro score and demand reversal evidence (for example, a failed auction).
A divergence setup—commodity leads, FX lags—works only when FX structure confirms; never rely on correlation alone.
Sizing adapts to regime:
- Normal position size may be used when all three lenses align, provided the trader remains aware that alignment does not eliminate the potential for adverse price movements.
- Smaller size when one pillar wobbles.
- Use higher timeframes and shorter holds when confidence is low.
Convert the weekly watchlist into if/then statements:
- If EIA prints a third draw and DXY is down → look to sell USD/CAD on a one-hour break-retest.
- If China PMIs beat and gold is firm while RBA leans hawkish → buy AUD/USD pullbacks.
- If GDT surprises higher and RBNZ is firm while USD softens → stalk NZD/USD dips that hold new support.
Journal lens scores and outcomes to identify whether you’re in a commodity-, USD-, or policy-led regime.
“Consistent journalling is what turns experience into edge. Patterns emerge long before price makes them obvious.” — Deriv Trading Coach
Disclaimer:
The information contained within this blog article is for educational purposes only and is not intended as financial or investment advice.
Trading is risky. Past performance is not indicative of future results. It is recommended to do your own research prior to making any trading decisions.


.png)