ما المتوقع في الذهب بعد الارتفاع الأخير
.jpeg)
تنبيه: هذا المحتوى ليس موجهًا لمواطني الاتحاد الأوروبي.
الصراع الأخير بين إسرائيل وحماس أثار ارتفاع أسعار الذهب، مدفوعًا بشكل أساسي بتغطية المراكز القصيرة. السؤال الآن هو ما إذا كان هذا الارتفاع سيتواصل.
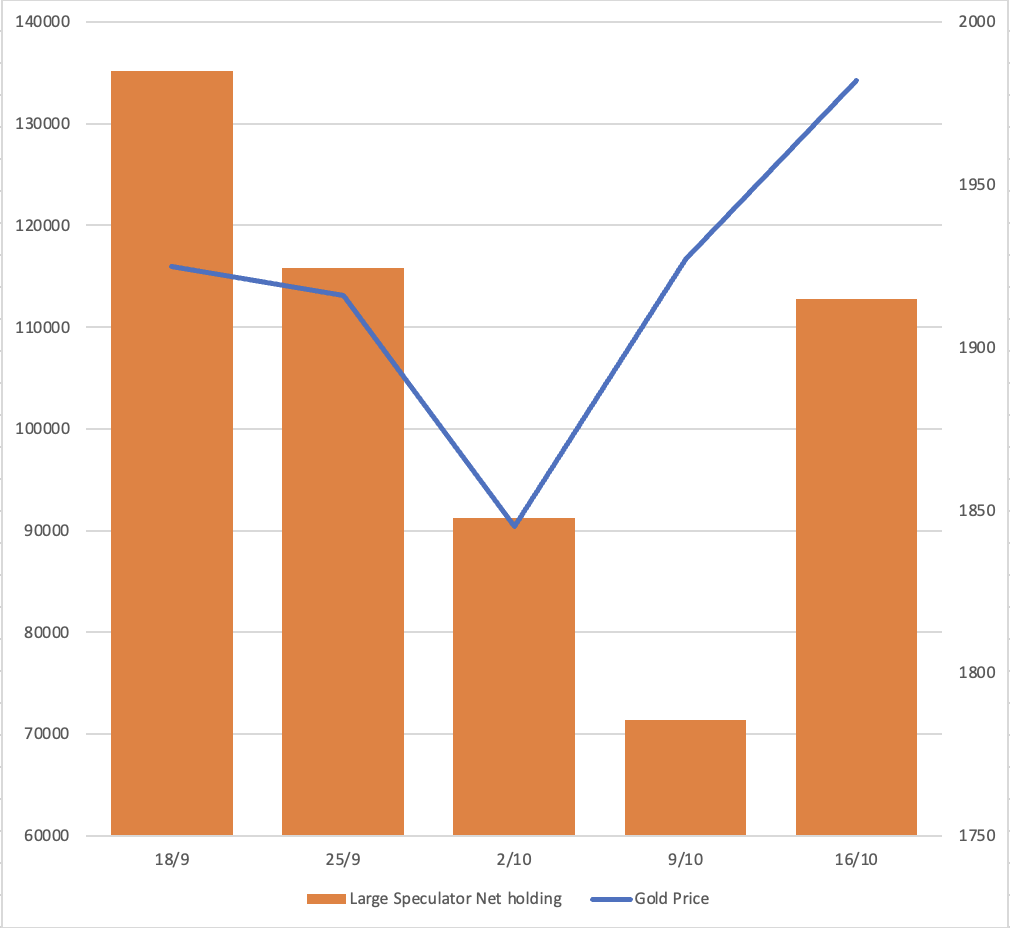
قبل حرب إسرائيل وحماس، أشار تقرير COT (التزام المتداولين) إلى أن المضاربين الكبار كانوا يتخذون مراكز قصيرة في سوق العقود الآجلة للذهب. ومع ذلك، بعد النزاع، تم تغطية هذه المراكز القصيرة في غضون أسبوعين، وكان هناك زيادة منخفضة في المراكز الطويلة. تقييم مقدار علاوة المخاطر المضافة إلى سعر الذهب أمر صعب. نظرًا لعدم اليقين في الوضع الحالي، من المحتمل أن يبقى المضاربون قصير الأجل حذرين ويتجنبوا بيع الذهب حتى يتضح الوضع.
حيازات المضاربين الكبار الصافية من تقرير COT لمفوضية تجارة العقود الآجلة (CFTC)
الذهب كسلعة ملاذ آمن
الذهب يعتبر غالبًا أصل ملاذ آمن؛ ومع ذلك، وفقًا لتقرير ABN Amro الصادر في 10 مارس 2022، فإن موثوقية حالة الملاذ الآمن للذهب غير متناسقة. هناك أوقات يتصرف فيها كاستثمار آمن وأوقات أخرى يظهر فيها خصائص أصل ذو مخاطر.
استنادًا إلى أحداث تاريخية مثل هجوم 11 سبتمبر الإرهابي في عام 2001، وحرب القرم في عام 2014، والنزاع بين روسيا وأوكرانيا في 2022، شهد سوق الذهب ارتفاعات ملحوظة بنسبة 6.5%، 11%، و11%، على التوالي. في الوقت الحاضر، وصل الصراع بين إسرائيل وحماس إلى مرحلة متقدمة، مع عدم دخول القوات البرية الإسرائيلية بعد. بالإضافة إلى ذلك، إذا تورطت دول أخرى في هذا النزاع، فقد شهد سوق الذهب بالفعل زيادة بنسبة 7.5% في القيمة. في حالة حدوث تصعيد آخر، تبقى احتمالية أن يشهد الذهب ارتفاعات إضافية احتمالًا واضحًا.

يطرح السؤال: هل كانت ديناميات جانب الطلب دور بارز في تشكيل اتجاه سوق الذهب؟

إمدادات الذهب تظل مستقرة نسبيًا، مع نطاق ربع سنوي ثابت يتراوح بين 1,100 إلى 1,250 طن. ما يؤثر بشكل أساسي على سعر الذهب هو جانب الطلب، وبشكل خاص الطلب على الاستثمار.
تؤدي صناديق الاستثمار المتداولة في الذهب دورًا حاسمًا في الحفاظ على توازن العرض والطلب للذهب. عندما يحدث تدفق للأموال من صناديق الاستثمار المتداولة، فإنه غالبًا ما يؤدي إلى انخفاض في سعر الذهب.


عند النظر إلى الرسم البياني أعلاه، يتضح أن الذهب يظهر أداءً أقوى خلال فترات تدفق صناديق الاستثمار المتداولة. رغم أننا سمعنا تقارير عن مشتريات الذهب من كيانات مثل البنك المركزي الصيني، والبنك المركزي التركي، والأفراد في الصين هذا العام، إلا أنه اعتبارًا من 29 سبتمبر، لا تزال هناك تدفقات صافية تخرج من صناديق الاستثمار المتداولة. لم يكن الطلب في آسيا كافيًا لتعويض التدفقات من باقي العالم. ولم يؤدي الذهب أداءً جيدًا.


ما العوامل التي تؤثر على الطلب على الذهب، خاصة من حيث الاستثمار؟ هل جاذبيته كملاذ آمن، أو كوسيلة للحماية من التضخم، أو تأثير السياسات النقدية هو ما يدفع الطلب على الذهب؟
- ملاذ آمن
كما ذُكر سابقًا، تشير تقارير ABN Amro إلى أن خصائص الملاذ الآمن للذهب غير متناسقة.
- الوقاية من مخاطر التضخم


استنادًا إلى الرسم البياني أعلاه، خلال فترة التضخم المنخفض من 2000 إلى 2006، أظهر الذهب ارتباطًا ضعيفًا مع CPI الأمريكي، حيث أظهر معامل ارتباط قدره -0.055. وبالمثل، من 2007 إلى 2023، لم يظهر الذهب ارتباطًا قويًا بالتضخم، حيث بلغ معامل الارتباط 0.36.
على سبيل المثال، عند مقارنة أعلى سعر للذهب في عام 2020، الذي كان 2,075 دولارًا أمريكيًا، ومعدل التضخم البالغ 2% في عام 2023، يظل أعلى سعر للذهب عند 2,075 دولارًا أمريكيًا بينما ارتفع التضخم إلى أكثر من 7%. إذا كان الذهب وسيلة فعالة للوقاية من مخاطر التضخم، فنحن نتوقع أن تتجاوز قيمته ذروة 2020.
- السياسة النقدية

يوضح الرسم البياني أعلاه العلاقة بين الذهب والعائد الأمريكي لثلاثة أشهر، كاشفًا عن نمط تاريخي حيث يرتفع الذهب عندما تنخفض العوائد، ولا سيما منذ عام 2006.
السؤال الآن هو: هل نقترب من نقطة تحول؟ هل سيستمر الاحتياطي الفيدرالي في سياسة رفع أسعار الفائدة؟ إذا بدأت توقعات السوق تأخذ في الاعتبار إمكانية خفض أسعار الفائدة من قبل الاحتياطي الفيدرالي، فقد يشير ذلك إلى بداية ارتفاع الذهب.
وفقًا لنموذج الاحتياطي الفيدرالي في أتلانتا، من المتوقع أن تبدأ عوائد الثلاثة أشهر في الانخفاض، مع أقرب توقع في يناير 2024 ولا يتجاوز يونيو 2024.

بينما وصلت المقارنة بين الذهب والين الياباني وكذلك الذهب والجنيه الإسترليني إلى أعلى مستوياتها على الإطلاق، فإن ذلك لا يضمن بالضرورة أن الذهب سيحقق ارتفاعًا قياسيًا جديدًا مقابل الدولار الأمريكي. ومع ذلك، فإنه يشير إلى أن الذهب من المحتمل أن يستمر في التعزيز عند قياسه مقابل عملات أخرى.
في بعض الأحيان، ارتفع كل من الدولار الأمريكي والذهب في وقت واحد، كما هو موضح في الرسم البياني السفلي الذي يجسد XAU/USD مقابل USD/EUR. تمثل المنطقة المظللة الفترات التي شهدت فيها كل من الدولار الأمريكي والذهب ارتفاعات متزامنة.

التحليل الفني
نمط الرسم البياني: على الرسم البياني طويل الأمد للذهب، يتشكل نمط الكوب والمقبض، مع ظهور الجانب الأيسر من الكوب في عام 2011. يبدو أن الذهب حاليًا في إطار تشكيل المقبض. إذا تمكن الذهب من اختراق مستوى المقاومة عند 2,080، يمكننا توقع ارتفاع آخر. من المهم أن نلاحظ أن الدعم من المتوقع أن يأتي حول 1,800.

تنويه:
التداول محفوف بالمخاطر.
الأداء السابق لا يعكس النتائج المستقبلية. نوصي بأن تقوم بإجراء بحثك الخاص قبل اتخاذ أي قرارات تداول.
المعلومات الواردة في هذه المقالة هي للأغراض التعليمية فقط وليس المقصود منها تقديم المشورة المالية أو الاستثمارية.


.jpeg)

