අලෙවිකරණ අරමුදල් සමග අවදානම් රහිත තරග කිරීමට සහ සැබැවින් මුදල් ත්යාග ජය ගැනීමට අවස්ථාවක් ලබා ගන්න.
මූල්ය වෙළෙඳපළවල් සහ 24/7 Derived දර්ශක මත විකල්ප ගනුදෙනු කරන්න.
මූල්ය කර්මාන්තයේ යථාර්ථයන් බෙදා හදා ගන්නා වෘත්තිකයන්ගෙන් අවබෝධයන් සොයා ගන්න.
වසර 25 කට අධික කාලයක් තිස්සේ ඩෙරිව් ලොව පුරා වෙළඳුන්ගේ විශ්වාසදායක හවුල්කරුවෙකු වී ඇත.
Wall Street මාසයක් තිස්සේ අසමින් සිටි ප්රශ්නයට අවසානයේ පිළිතුරු ලබා දෙමින් සතිය අවසන් කළ අතර, වහාම තවත් ප්රශ්නයක් එහි ස්ථානය ගත්තේය.
Deriv හි swap-free සති අන්තය මඟින් වෙළඳුන්ට රාත්රී අරමුදල් ගෙවීමකින් තොරව සිකුරාදා සිට සඳුදා දක්වා Synthetic Index ස්ථාන තබා ගැනීමට ඉඩ සලසයි.
Nasdaq 100 චක්රයේ වඩාත්ම සංකේන්ද්රිත පැය 48 ක ඉපැයීම් කවුළුව වෙත යමින් නව වාර්තාවක පිහිටා ඇත — සහ ප්රශ්නය වන්නේ AI යටිතල පහසුකම් වෙළඳාමට එහිම සාර්ථකත්වයෙන් බේරී සිටිය හැකිද යන්නයි.
මෙම සතියේ Bitcoin නැවතත් ඩොලර් 77,000 ට වඩා ඉහළට ගෙන ගිය ETF ලංසුව, එය අවශෝෂණය කර ගැනීමට නියමිතව තිබූ විකුණුම්කරුවන් වෙත කෙලින්ම ගමන් කරයි.
S&P 500 7,100 ට වඩා ඉහළ වාර්තාගත කලාපයකට නැවත පැමිණ ඇත, නමුත් නවතම ප්රගතිය ප්රධාන මට්ටමෙන් යෝජනා කරනවාට වඩා බිඳෙනසුලු බවක් පෙනේ.
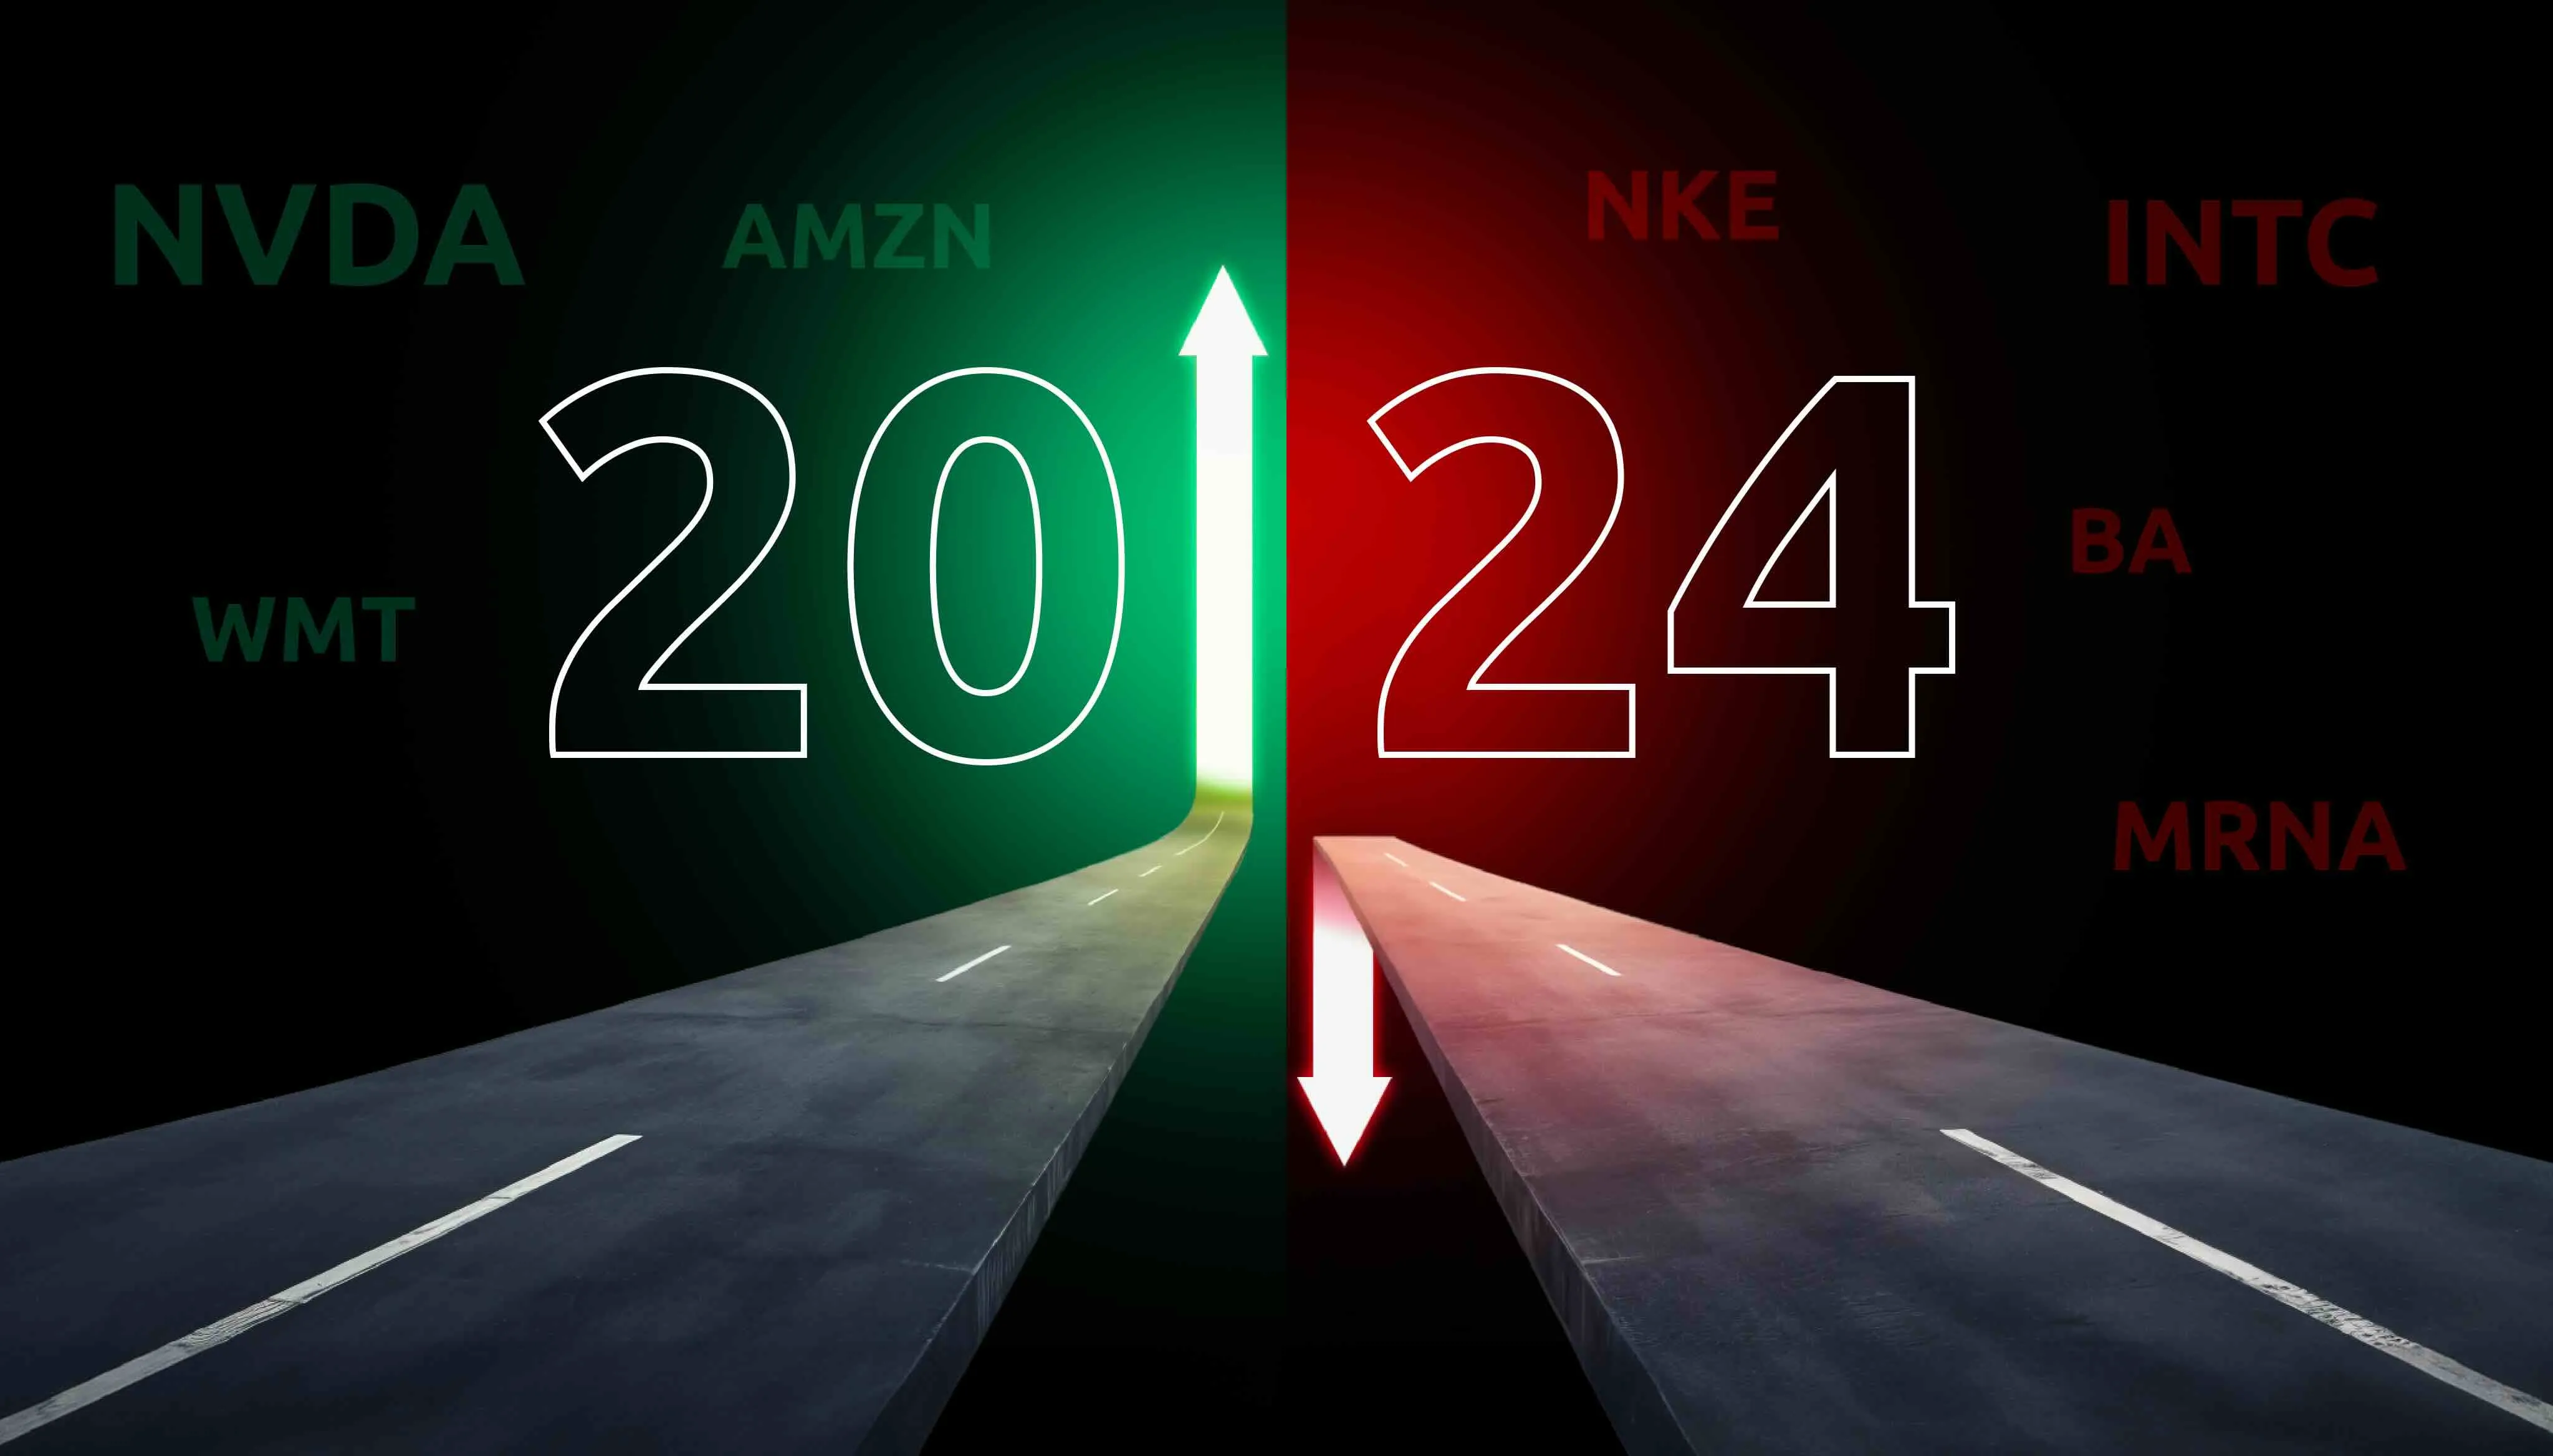
The question traders are navigating is not whether Q1 numbers were good, but whether company guidance can hold up under conditions that no forecast model anticipated three months ago.
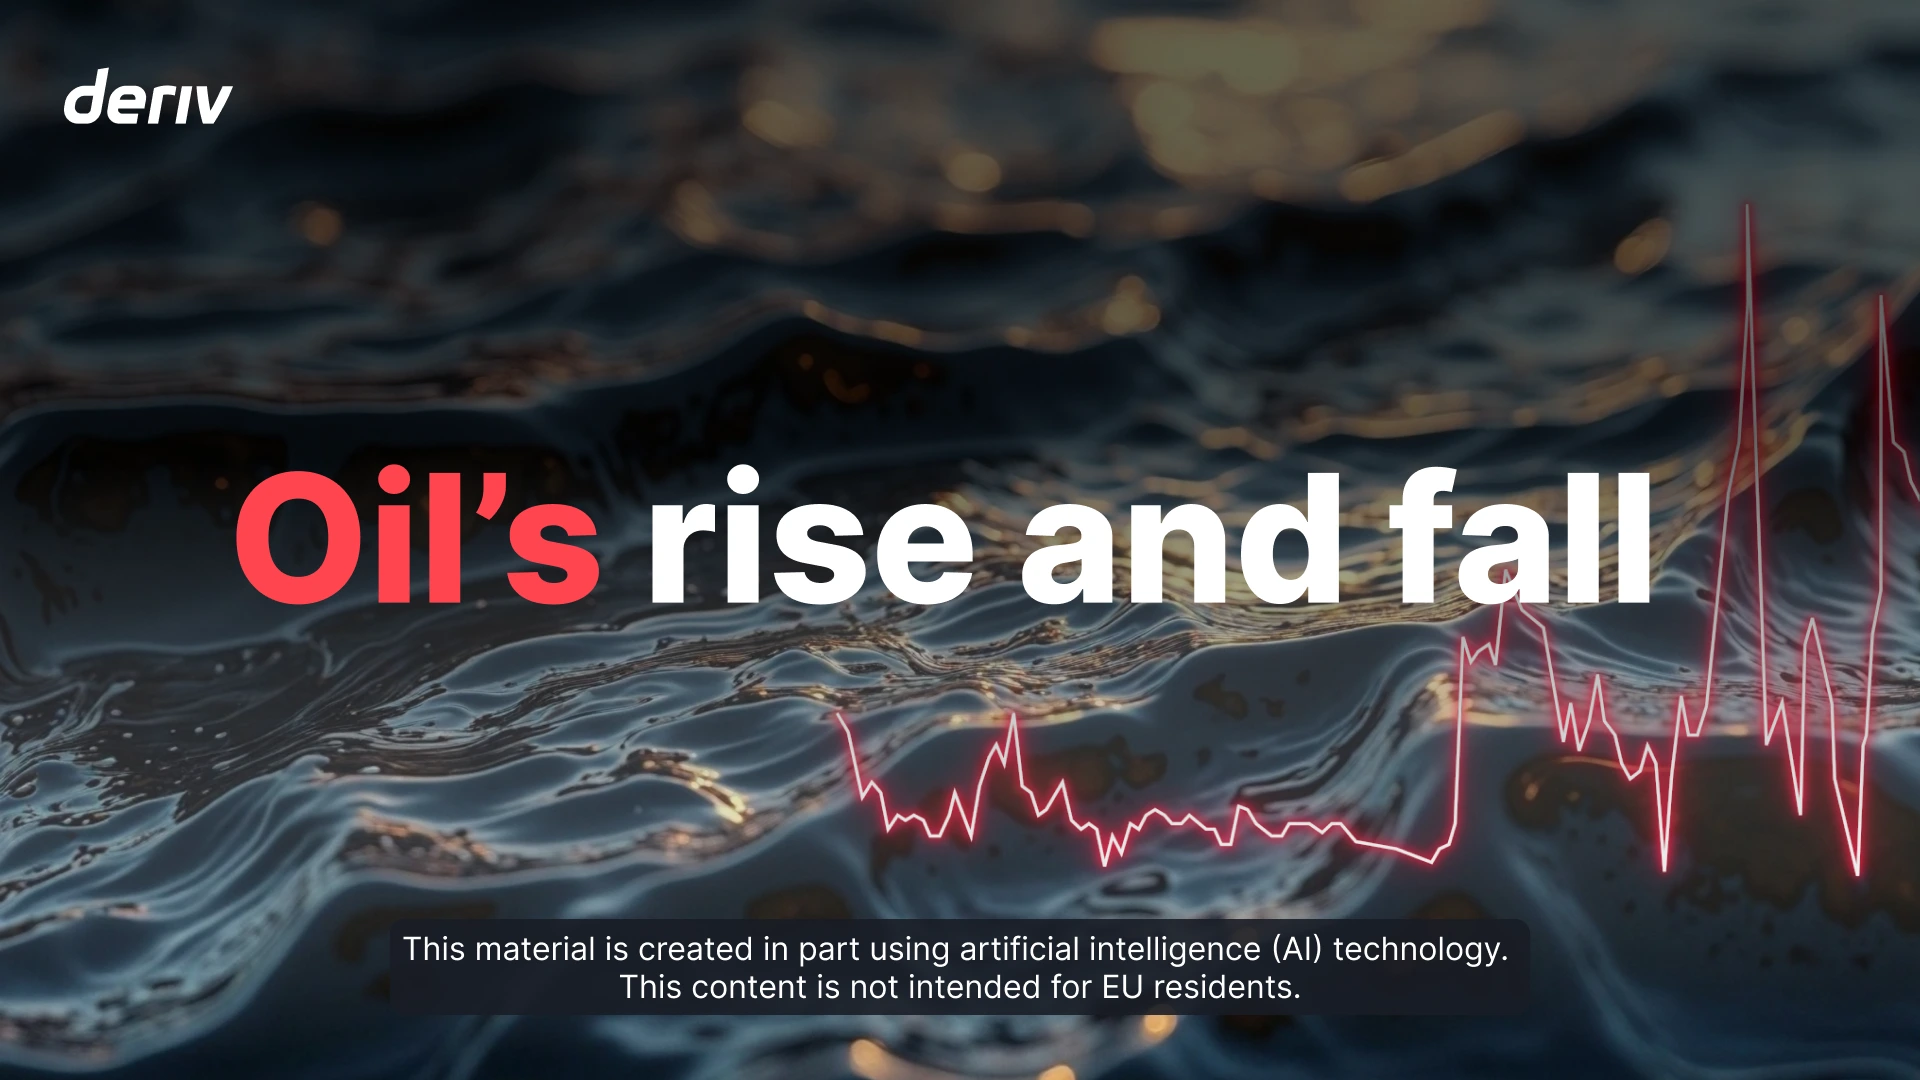
ටෙක්සාස් තෙල් උත්පාතයේ සිට නූතන බලශක්ති අර්බුද දක්වා, ගෝලීය වෙළඳපොල සහ ආර්ථිකයන් මත තෙල්වල බලපෑම අපි සොයා බලමු.
අපගේ නවතම වෙළඳපල විශ්ලේෂණය මගින් මෑත කාලීන ඇමරිකා-චීන වෙළඳ වර්ධනයන් සහ ගෝලීය වෙළඳපල කෙරෙහි ඒවායේ බලපෑම, වෙළඳපල අස්ථාවරත්ව රටාවන් සහ cryptocurrency ප්රවණතා පිළිබඳ අවබෝධය සමඟ විමසා බලයි.
ඩෙරිව් සීට්රේඩර් හි උපාය මාර්ග සැපයුම්කරුවෙකු බවට පත්වීමෙන් ඔබේ වෙළඳ කුසලතා ඉහළ ඉපැයීම් බවට පරිවර්තනය කරන්න - අපගේ සවිස්තරාත්මක මාර්ගෝපදේශය ආරම්භ කිරීමට ඔබට උපකාරී වනු ඇත!
ඇමරිකානු ඩොලර් වලට එරෙහිව යෙන් ව්යාපාරවල බලපෑම සහ ජපාන බැංකුවේ විභව මැදිහත්වීම පිළිබඳව අපි ගවේෂණය කරමු.
උද්ධමනය සහ වෙළඳපල අස්ථාවරත්වය මධ්යයේ Netflix, Meta සහ Microsoft හි Q1 ඉපැයීම් වෙළඳුන්ට තීරණාත්මක වන්නේ කෙසේද? මෙම සතියේ InFocus තුළින් ඒ පිළිබඳ අවබෝධයක් ලබා ගන්න.
මෙම නවතම ඉන්ෆොකස් කථාංගයේදී, ඔබේ වෙළඳාම් කෙරෙහි උද්ධමනයේ බලපෑම අපි විමසා බලමු.


.webp)