Bitcoin crashes under $90K as ‘death cross’ bites

Bitcoin slipped below 90,000 dollars on Tuesday, extending a selloff that has erased its 2025 gains and pushed sentiment toward the bleak end of the spectrum. Spot prices printed as low as 89,420 dollars, the weakest level since February, only six weeks after setting a record near 126,250 dollars.
The breakdown coincided with a bearish technical crossover known as a death cross and increasingly hesitant fund flows into U.S. spot ETFs.
Together with macro anxiety around the rate path, these factors have tightened liquidity and amplified swings across majors. The next phase hinges on whether price can quickly reclaim lost support and whether ETF prints stabilise from recent choppiness.
What’s driving the slide
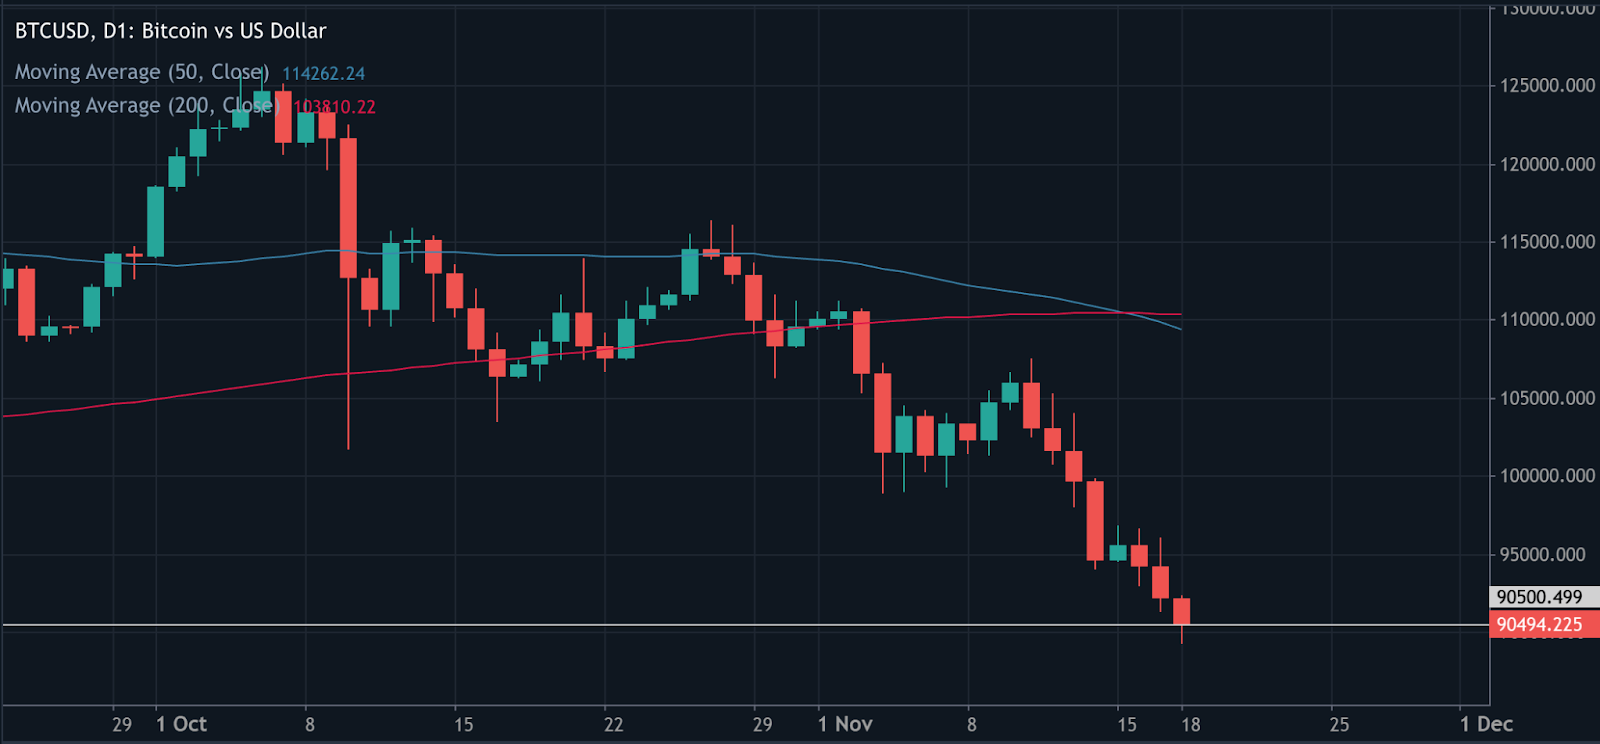
The proximate trigger is technical: Bitcoin fell back through reclaimed support near 93,700 dollars, lost its 200-day moving average, and then registered a death cross as the 50-day slipped beneath the 200-day.
On its own the signal is imperfect, but in weak liquidity regimes it often coincides with multi-week drawdowns as momentum traders de-risk.
Flows add fuel. U.S. spot ETF activity has turned choppy after heavy intake earlier in the year, with trackers showing sequences of outflows or flat prints that blunt marginal demand. When the incremental demand fades, price tends to chase lower liquidity pockets until new buyers emerge. Recent dashboards corroborate the stop-start nature of ETF demand. CoinDesk+1.
The Mt. Gox repayments - a trigger, not the cause
Adding fuel to the fire, over 10,600 BTC (worth roughly $953 million) were transferred from Mt. Gox wallets on 18 November 2025, marking the first such movement in eight months.

The long-running repayment saga, stemming from the 2014 collapse of the world’s then-largest exchange, has left creditors waiting over a decade for compensation.
While some feared that repayments could unleash fresh supply, blockchain data shows these movements were administrative, not market sales. Still, perception alone was enough to unsettle sentiment, sparking liquidations and feeding the broader risk-off tone. Analysts now estimate over 230,000 trading accounts were liquidated within 24 hours, totalling more than $1 billion in forced sell orders.
Why this matters
Sentiment has swung hard into fear. CoinDesk flagged “extreme fear” conditions into the weekend and early week, aligning with widely followed gauges that punish downside volatility and negative breadth. In past cycles, similar extremes have marked acceleration phases within larger drawdowns or short-lived exhaustion points.
The macro overlay is not helping. Traders are parsing shifting expectations for U.S. rate cuts and inflation risks tied to policy developments, a mix that reduces risk appetite and tightens crypto liquidity. Reuters’ read-across captures the mood: a near 30 percent retreat from the October peak and growing caution among institutions.
Impact on markets and participants
Price leadership rotated back to bitcoin as traders sold altcoins to manage risk, a pattern visible when social attention and volumes consolidate in the benchmark asset during stress. Ether and other large caps have tracked lower alongside, while crypto-linked equities have generally underperformed on drawdown days, transmitting crypto volatility into listed proxies.
For allocators, ETF prints serve as the cleanest real-time barometer of spot demand. Multi-day flat or negative flows often coincide with fragility in order books and heavier slippage, which is why desks are laser-focused on whether the next sequence turns positive again. If it doesn’t, the unfilled liquidity pocket toward 86,000–88,000 dollars cited by traders continues to be a live risk.
Expert outlook
CoinDesk’s market desk notes that fear spikes of this magnitude have sometimes preceded relief rallies, particularly when realised-loss pressure begins to stabilise and ETF outflows slow. That requires confirmation: a swift reclaim of broken support and evidence of renewed net inflows. Until then, technicals and positioning argue for elevated two-way volatility.
Long-horizon investors continue to point at structural adoption and institutional participation as reasons to stay constructive on multi-year horizons. Dan Tapiero, whose 50T platform backs later-stage crypto companies, frames short-term turbulence as noise against a secular build-out, a view he has reiterated while forecasting a much larger digital-asset economy over the next decade.
Bitcoin price technical insight
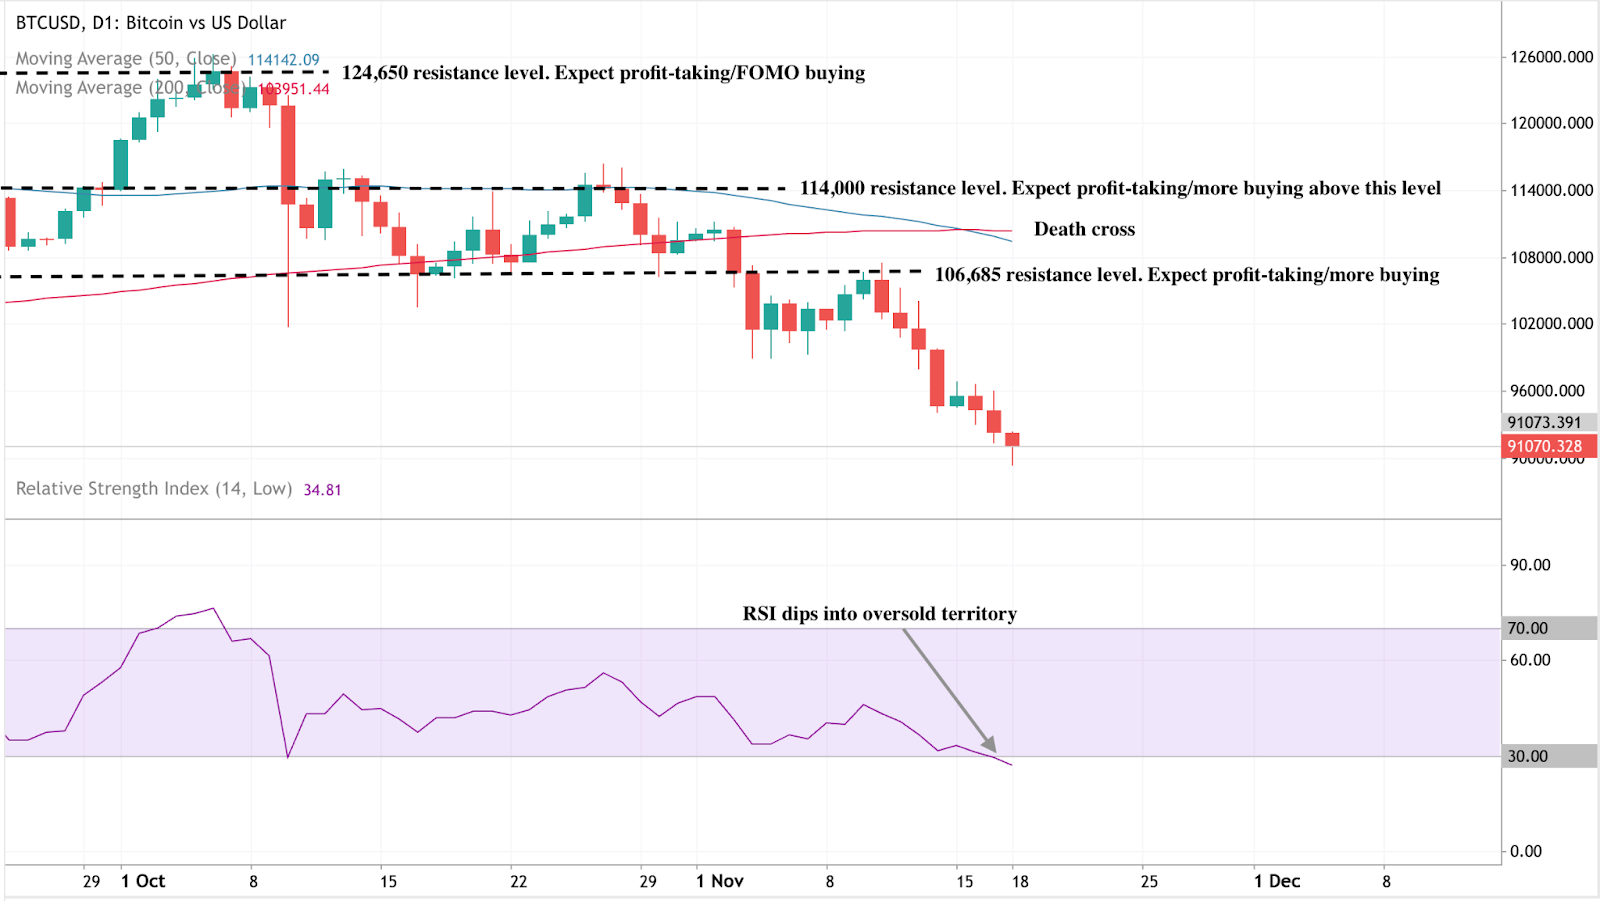
Bitcoin (BTC/USD) continues its downward trajectory after forming a death cross, with the 50-day moving average (MA) crossing below the 200-day MA - a classic bearish signal suggesting extended downside pressure. The price is currently hovering near $91,000, after repeatedly failing to hold above key resistance levels at $106,685, $114,000, and $124,650, where prior rallies saw heavy profit-taking and FOMO-driven buying.
The Relative Strength Index (RSI) has dipped into oversold territory, indicating that selling momentum may be overextended and a short-term technical rebound could occur. However, as long as BTC remains below the 50-day MA, the broader trend remains bearish, with traders likely to view any bounce as a chance to sell into strength.
Key takeaway
Bitcoin’s slide below $90,000 reflects a convergence of technical breakdown, hesitant ETF demand, and a risk-off macro tone. The resulting fear spike is typical of late-stage selloffs, but it needs flow confirmation before calling a durable low. Watch for a quick reclaim of the $ 90,000 - $93,000 zone and a run of positive ETF prints to validate any rebound attempt. Until then, expect elevated volatility and tighter liquidity conditions.
The performance figures quoted are not a guarantee of future performance.


