Fed pause, oil shock: The 2026 CPI playbook traders are using right now
With Brent crude sitting above $100 and the Fed still on pause after January’s hold, the macro setup feels eerily familiar—disinflation stalling just as energy risks flare.
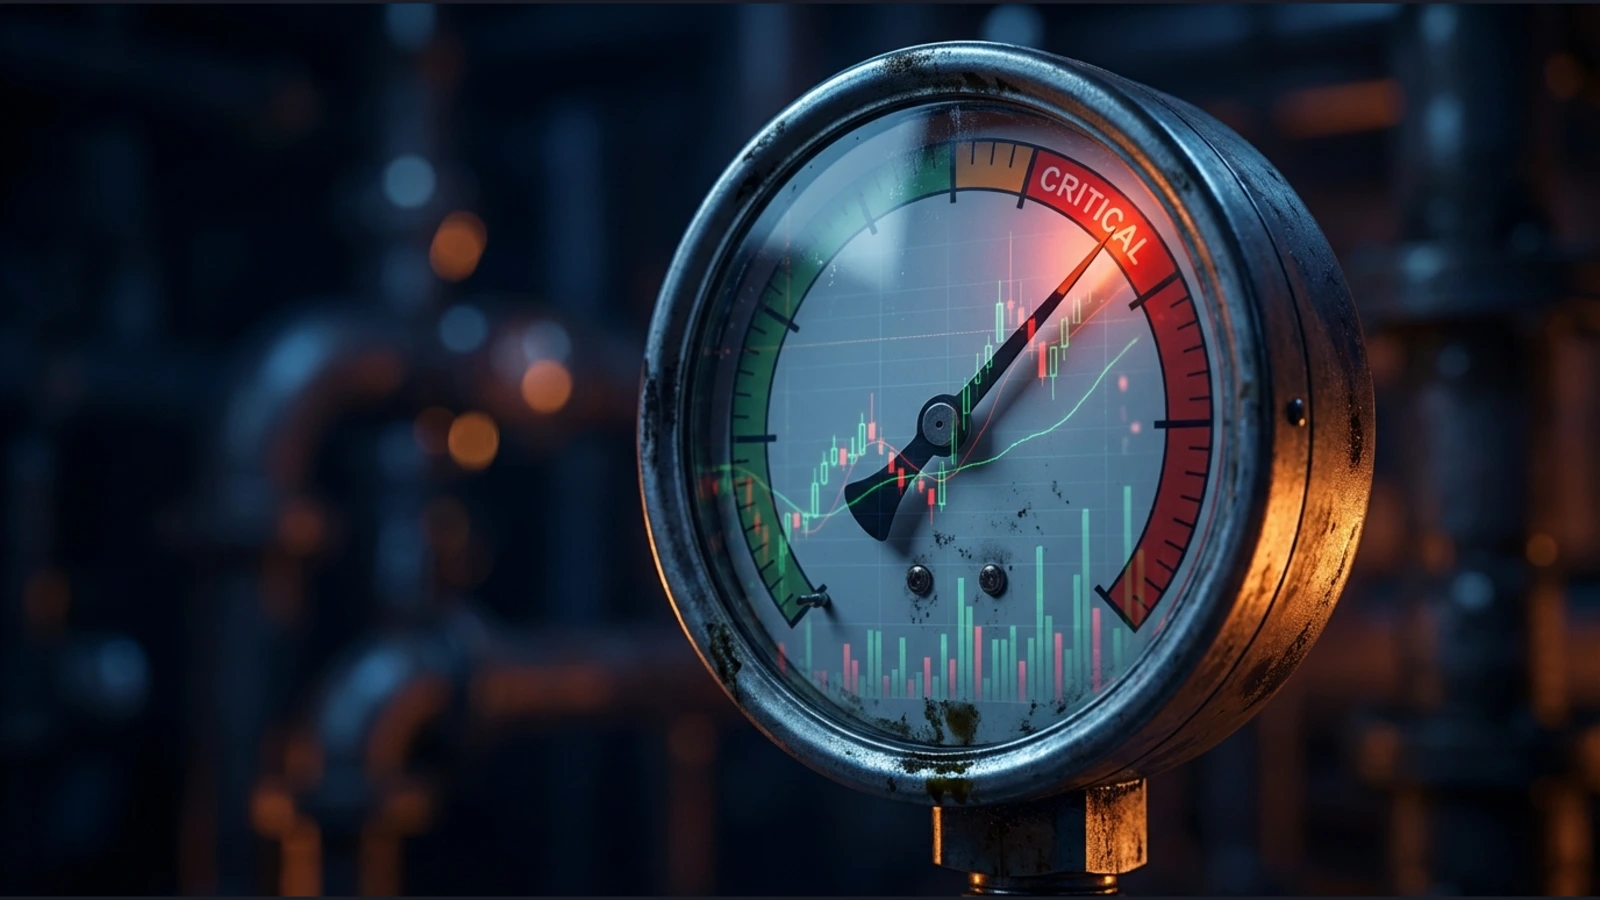
Tomorrow morning (March 11, 2026, 8:30 AM ET), the February CPI print drops. Traders aren’t guessing the number; they’re positioning for the reaction, drawing directly from the January CPI / FOMC cycle and the playbook that worked through 2022–2025 volatility.
Here’s a breakdown of what happened last time, the historical parallels that still matter, the oil-shock scenarios now in play, and the exact strategies macro and options traders are running heading into tomorrow’s release.
Quick recap: January FOMC + February CPI cycle
- FOMC (Jan 27–28, 2026): Rates held at 3.50–3.75%. Two dissenters wanted a cut. The statement emphasized “solid activity,” “resilient labor,” and inflation “still elevated” near 2.5–3%. Markets priced ~88% chance of no change at March FOMC.
Reaction: muted. S&P +0.08%, 10-year yield +2.6 bp to 4.251%. - CPI (Feb 13, 2026 – Jan data): Headline +0.2% MoM (below 0.3% expected), +2.4% YoY (below 2.5%). Core +0.3% MoM (as expected), +2.5% YoY (slowest since early 2021). Energy -1.5% MoM (gasoline -3.2%) drove the downside surprise.
Reaction: risk-on relief. S&P rallied 0.3–0.75% intraday, 10-year yield -3.5 bp, June cut odds jumped toward ~83%.
The soft print brought back some disinflation narrative, but the Fed’s cautious tone and rising oil have kept core sticky and cut expectations contained.
Historical echoes that still guide positioning
- 2022 peak (9.1% YoY headline) → aggressive 11-hike cycle → S&P -19.4%, Nasdaq -33%.
- 2023 pivot signal (Dec) → S&P +24% in 2024.
- Late 2025 cuts (three 25 bp) → core fell to ~2.6%, tech rotated higher.
- Key lesson: soft headline prints + energy relief = short-term equity pops and yield dips. Sticky core + oil premium = “higher for longer” repricing and defensive rotations.
Traders know March 11 outcomes can swing 1–2.5% on the S&P depending on how energy and shelter land. The question isn’t “will it be hot or cold?”but it’s “how do we trade the fakeout, the follow-through, or the reversal?”
2026 oil shock scenarios: The wildcard everyone is hedging
Oil is carrying a $4–10 geopolitical risk premium right now (Iran tensions, shipping disruptions). Base forecasts still see oversupply dragging Brent toward $60–65 average for the year, but a sustained shock changes everything.
A severe shock could add 28–110 bps to headline CPI (depending on duration and pass-through) and freeze or reverse Fed cut pricing, echoing 2022’s energy-driven re-pricing.
The playbook traders are running right now (pre-CPI)
- Volatility structures
- Some are positioned in long gamma setups (butterflies, iron condors with wide wings) to capture range-bound post-print chop.
- OTM strangles or strangles with broken wings for directional conviction are being put on if shelter surprises.
- Many are long front-month VIX calls or VIX futures to hedge “scam wick” volatility (sharp fake move then reversal).
- Directional / sector bets
- Traders who expect a soft print are in pre-buy dips in tech/growth (lower yields help multiples).
- Others are preparing for a hot print or oil bleed-through → with fade initial equity spike, rotate to defensives (utilities, staples), and are long energy.
- XLE calls or energy producer names indicating asymmetric hedge against $100+ oil persisting.
- Rate & yield plays
- Some traders are positioned short TLT / long 10-year note futures if print comes in-line or softer (yields dip).
- Historically, fade yield pops on hot prints (some traders sell rallies in bonds if core stays sticky).
- SOFR futures positioning still leans 1–1.5 cuts for 2026 overall, but a hot CPI could push March odds to near-zero.
- Post-print execution rules
- Some desks are waiting for the first 15–30 min “scam wick” to fade before adding size.
- Others are using historical reaction bands: soft core (<0.3% MoM) → +1.25–1.75% S&P potential; hot core (>0.4%) → –1 to 2% sell-off.
- Some traders are preparing to watch the second order if energy components jump: airlines, trucking, consumer discretionary underperform.
Bottom line
Tomorrow’s February CPI isn’t about calling the exact print—it’s about trading the Fed’s reaction function in an environment where oil risk sits squarely on the dashboard. The January cycle showed traders how to fade volatility, rotate sectors, and hedge energy tails. The same playbook is live right now, just with higher stakes.
2026 is the kind of year where the data can look calm while the risk structure quietly becomes unstable. The last CPI/FOMC sequence showed how quickly markets shift from “cut optimism” to “constraint anxiety,” and oil has just reminded everyone that disinflation is not a forcefield.
Define your risk and let the tape tell you whether we’re still in disinflation mode or shifting back toward reflation/stagflation territory.
The performance figures quoted are not a guarantee of future performance.


