XAU/USD — Gold

The price of gold has closed green for four weeks in a row and above its key resistance level of $1820. It also made a fresh five-month high last Friday. It moved a massive 9% from the recent flash low it made in the month of August at the $1680 level. On a daily basis, the 100 SMA has crossed the 200 SMA, indicating a Golden crossover for the short to medium term. However, it is important for the prices to cross the $1830-40 zone, which it has failed to cross for the last four months. On the daily and weekly time frames, the RSI is trading at 53 and 61 respectively, which suggests further upside is likely. Technically, once it manages to cross its immediate resistance zone, the next level to watch out for will be the $1849 and $1877 levels. While on the downside, $1787 will act as the first support followed by $1746 as the major support.
Trade Gold options on DTrader and CFDs on Deriv MT5 Financial account.
XAG/USD — Silver

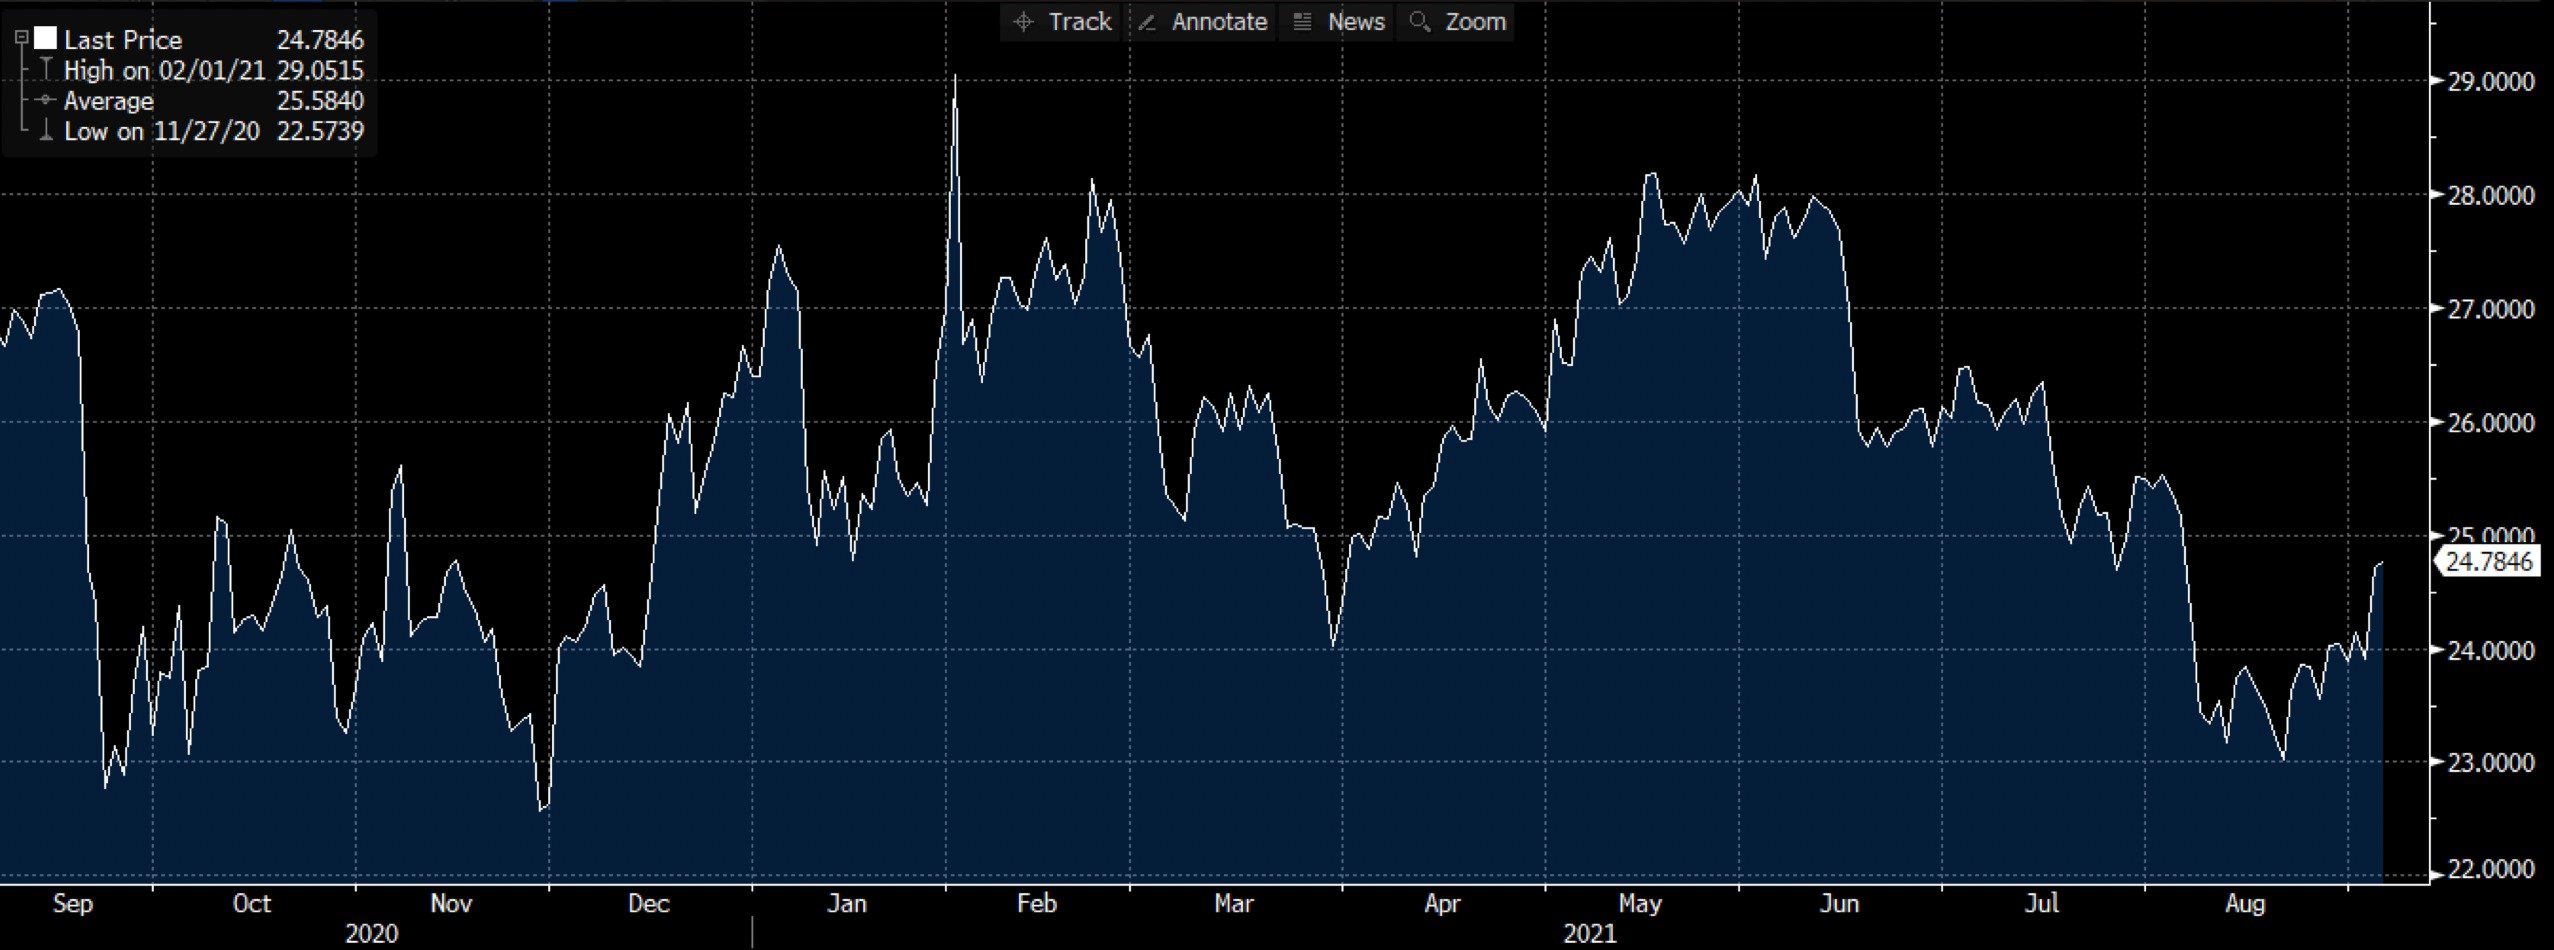
Silver prices crossed the four-week high last week and closed near their 50-week moving average of around $24.68. The weak U.S. dollar and lower-than-expected US job numbers helped precious metals to go up in the past week. Daily and weekly RSI are at 56 and 46, suggesting further price gains may be expected. The 200-day SMA at $25.95 could be the next resistance on a daily basis. On the other hand, the weekly 100-day SMA might act as the major support near $22 levels.
Trade Silver options on DTrader and CFDs on Deriv MT5 Financial account.
EUR/USD

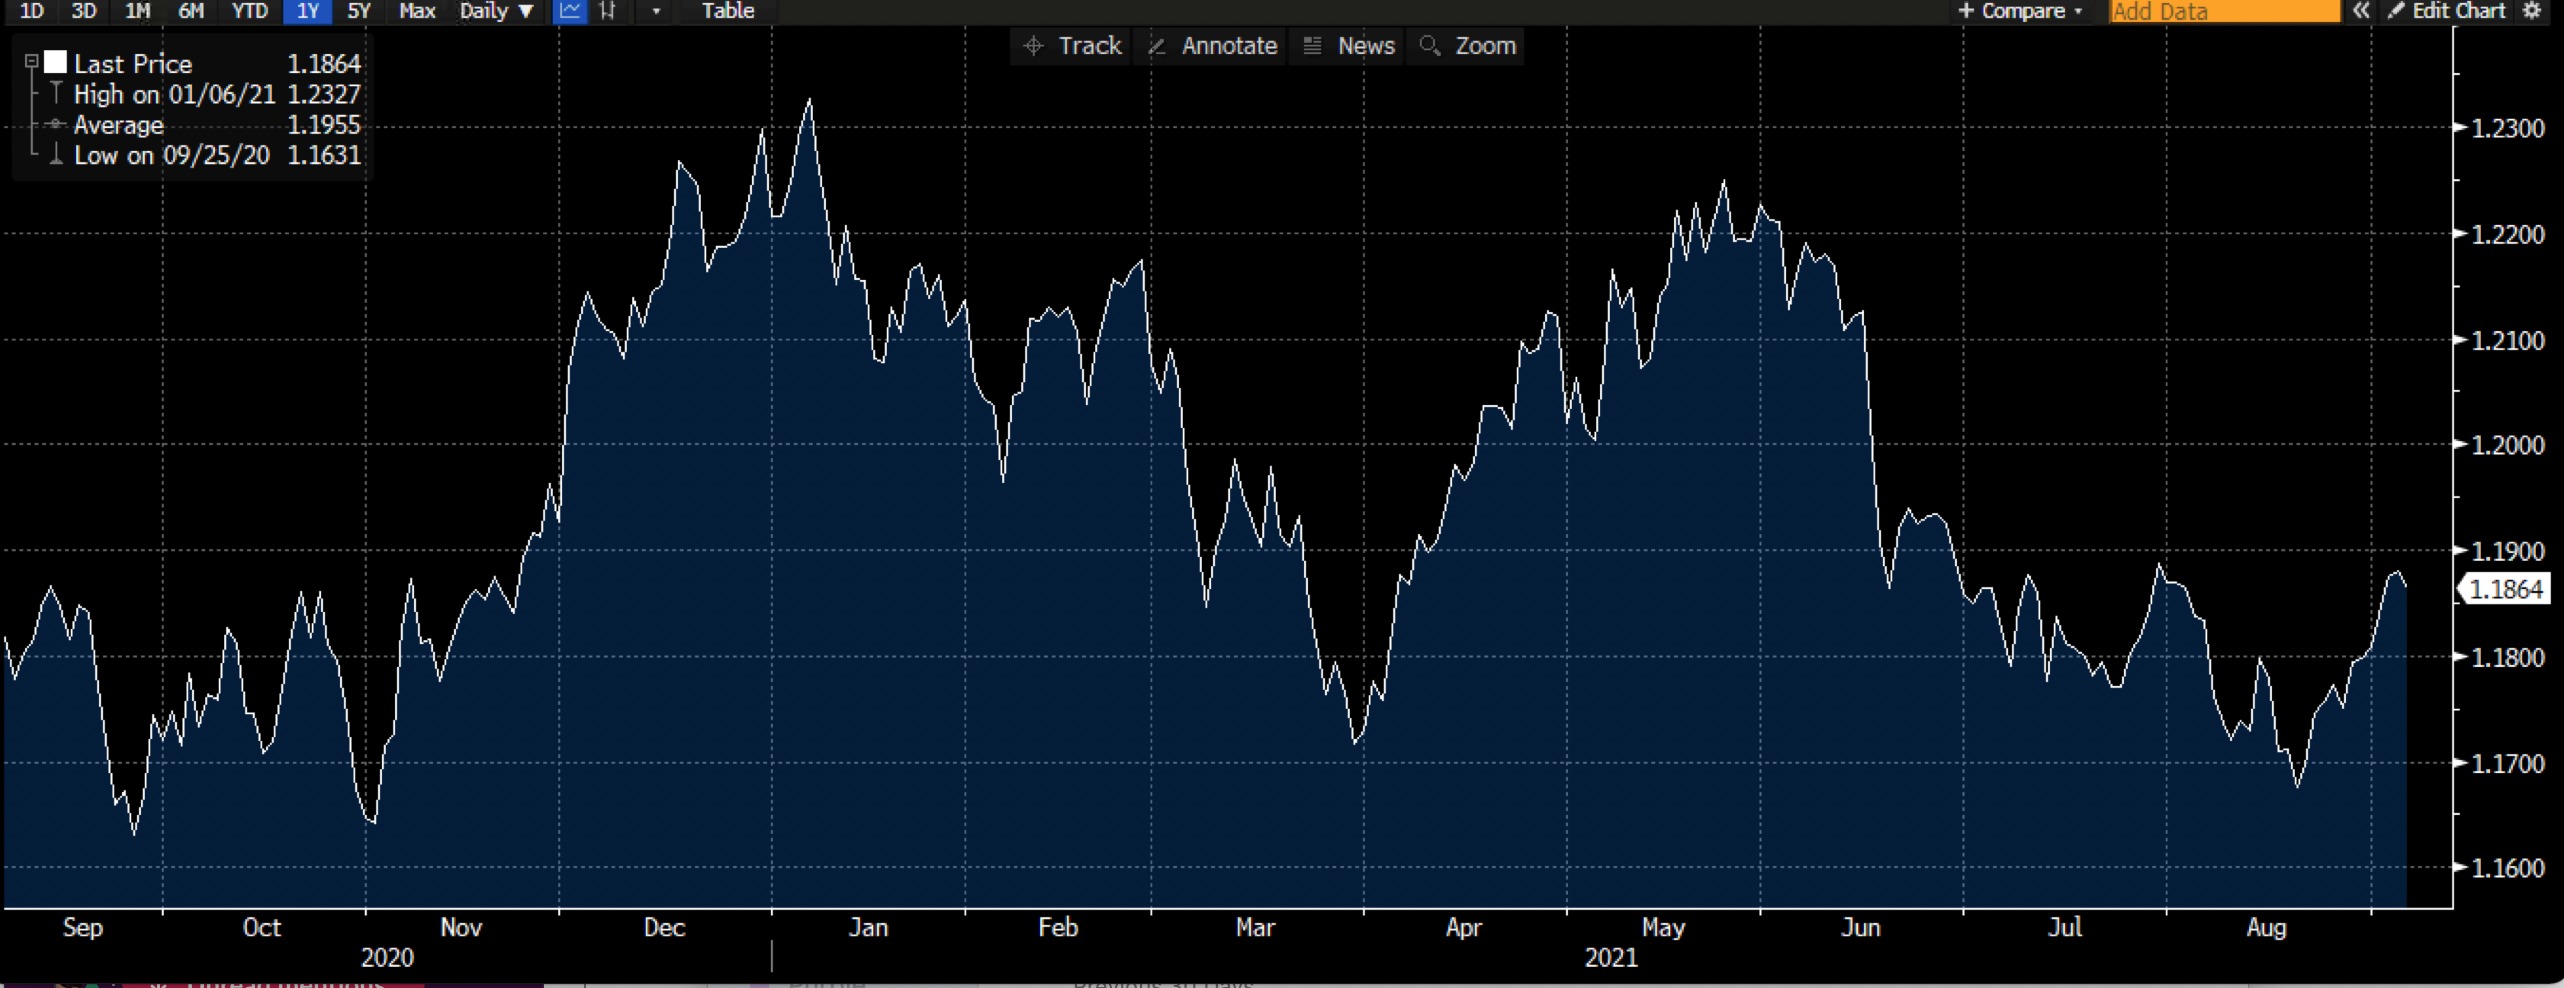
EUR/USD reached a new three-month high last Friday. The weak US dollar and lower than expected US employment data helped the EUR/USD close near 1.18680 this week. The price managed to close above the major resistance level of 1.1850. When it crosses the 1.1930-50 zone, it might attempt to reach the 1.20 level. The price has multiple support between 1.1750 and 1.170 on the lower side. The EUR/USD pair has been trading sideways for the past three months; a reversal of trend can only be achieved if it manages to close above 1.20.
Trade EUR/USD options on DTrader and CFDs on Deriv MT5 Financial and Financial STP accounts.
NASDAQ — Tech 100

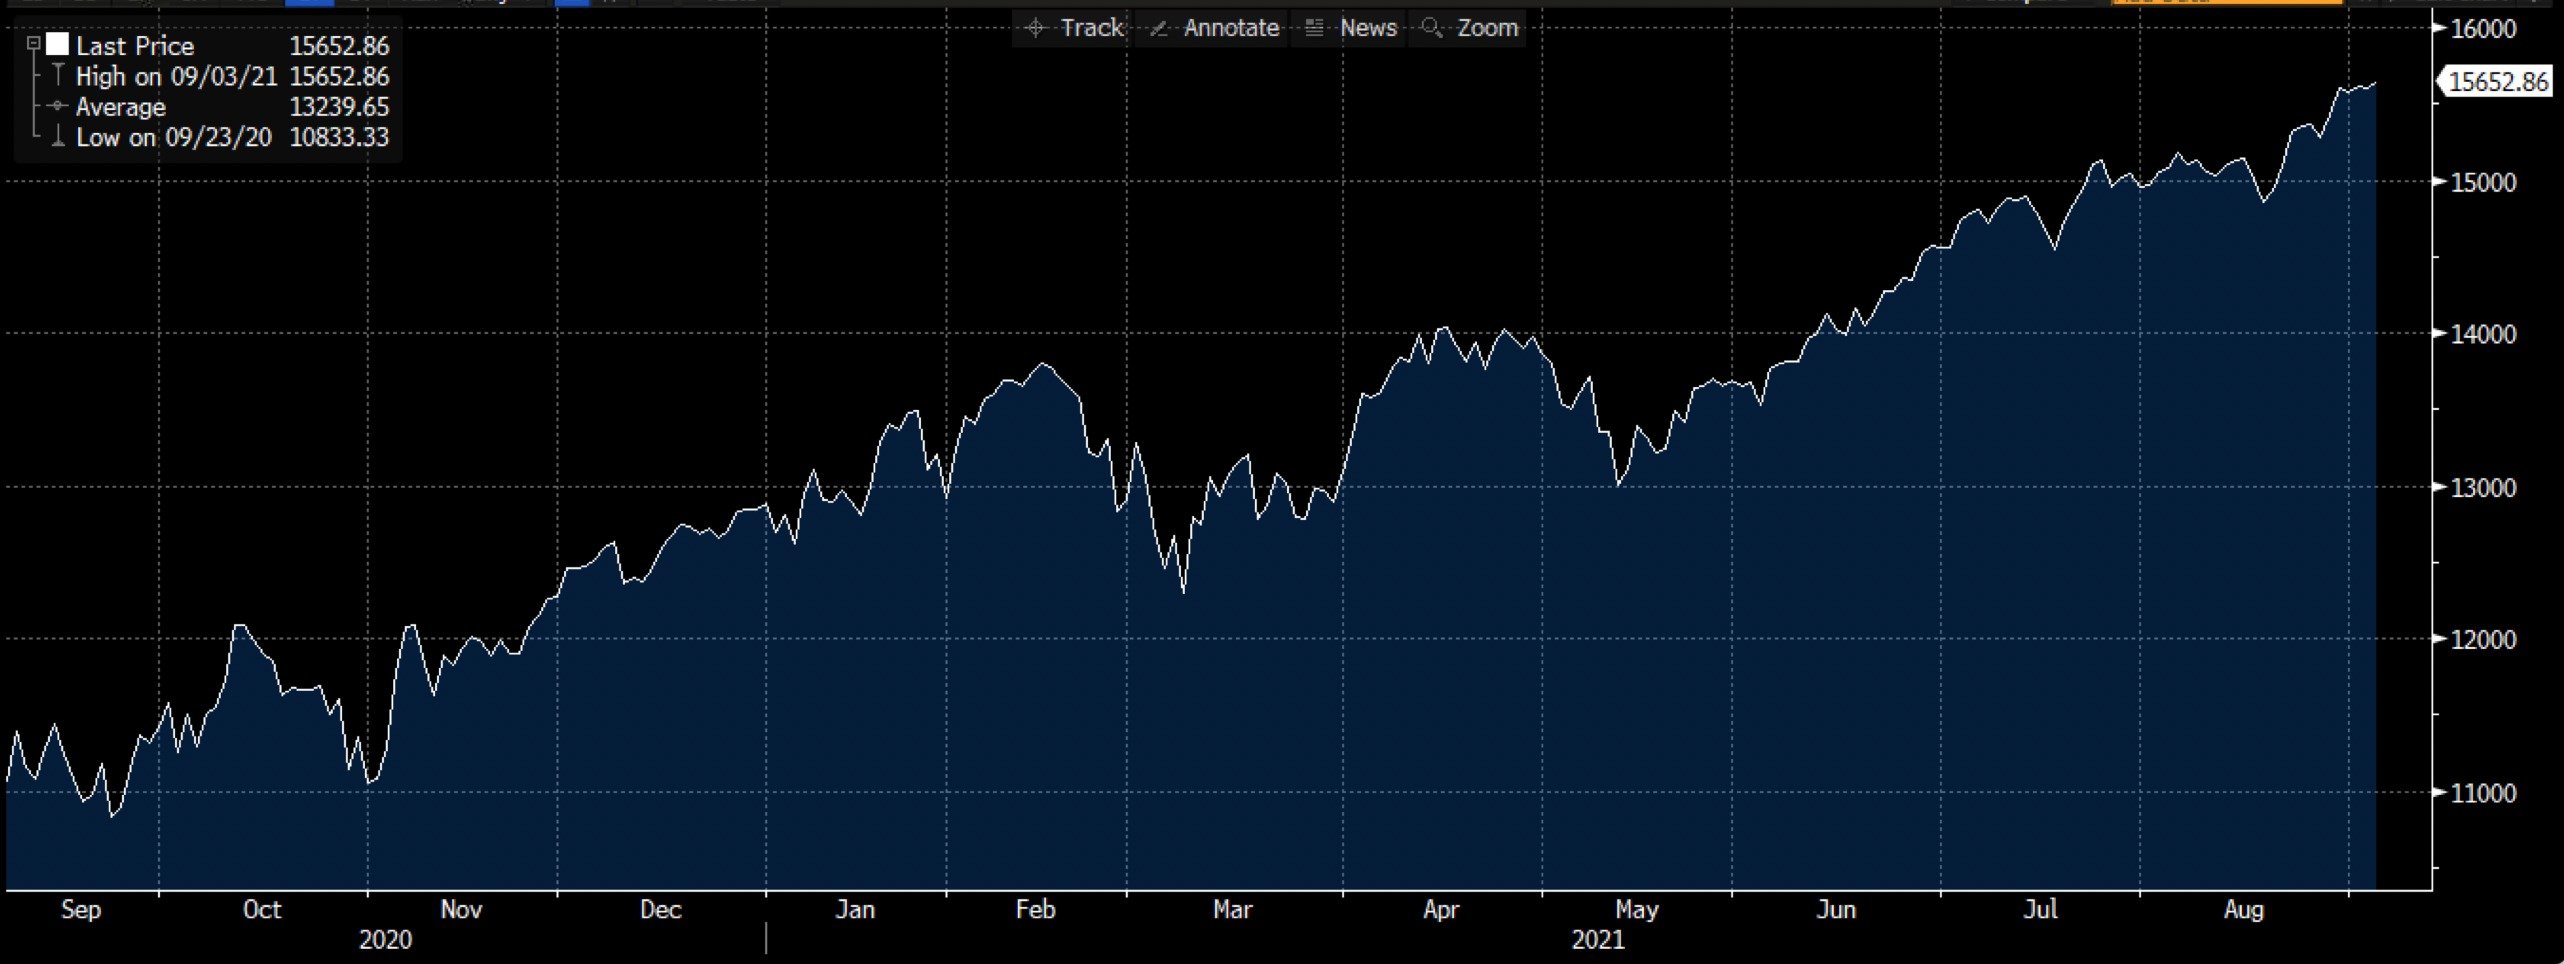
This year, the Nasdaq is in a growth trend and has gained almost 22%. Last Friday, it reached a new record high of 15699. According to US unemployment data, interest rate tempering has been delayed, helping major indices to trade higher. Though the Nasdaq seems to be trending upward, technical indicators indicate an overbought zone. The RSI is at 80 and 75 on a monthly and weekly basis, respectively, suggesting risks of time correction. There is a strong resistance near 16,000 on the upper side, and there is support near 14800 and 14450 on the lower side.
Trade US Tech Index options on DTrader and CFDs on Deriv MT5 Financial accounts.
Disclaimer:
Options trading on stock indices, commodities, and forex on DTrader are not available for clients residing within the European Union or the United Kingdom.
