While trying to understand how prices move in different markets, technical analysis pioneers have discovered that the price often moves in a certain direction after forming a certain pattern. This discovery has soon turned into a trading discipline, commonly used by traders nowadays.
There are a lot of chart patterns you can use in your technical analysis, but they all follow the same logic: the support trend line is at the bottom, and the resistance trend line is at the top. All the patterns are generally divided into 3 main categories:
- Reversal patterns
- Continuation patterns
- Bilateral patterns
Essentially, every group is used to predict whether the price will continue to move in the same direction as before the pattern started. Let’s see how each one of them works.
Reversal chart patterns
Reversal chart patterns are likely to indicate that the trend is about to change its direction.
Here are some of the most common reversal chart patterns:
-
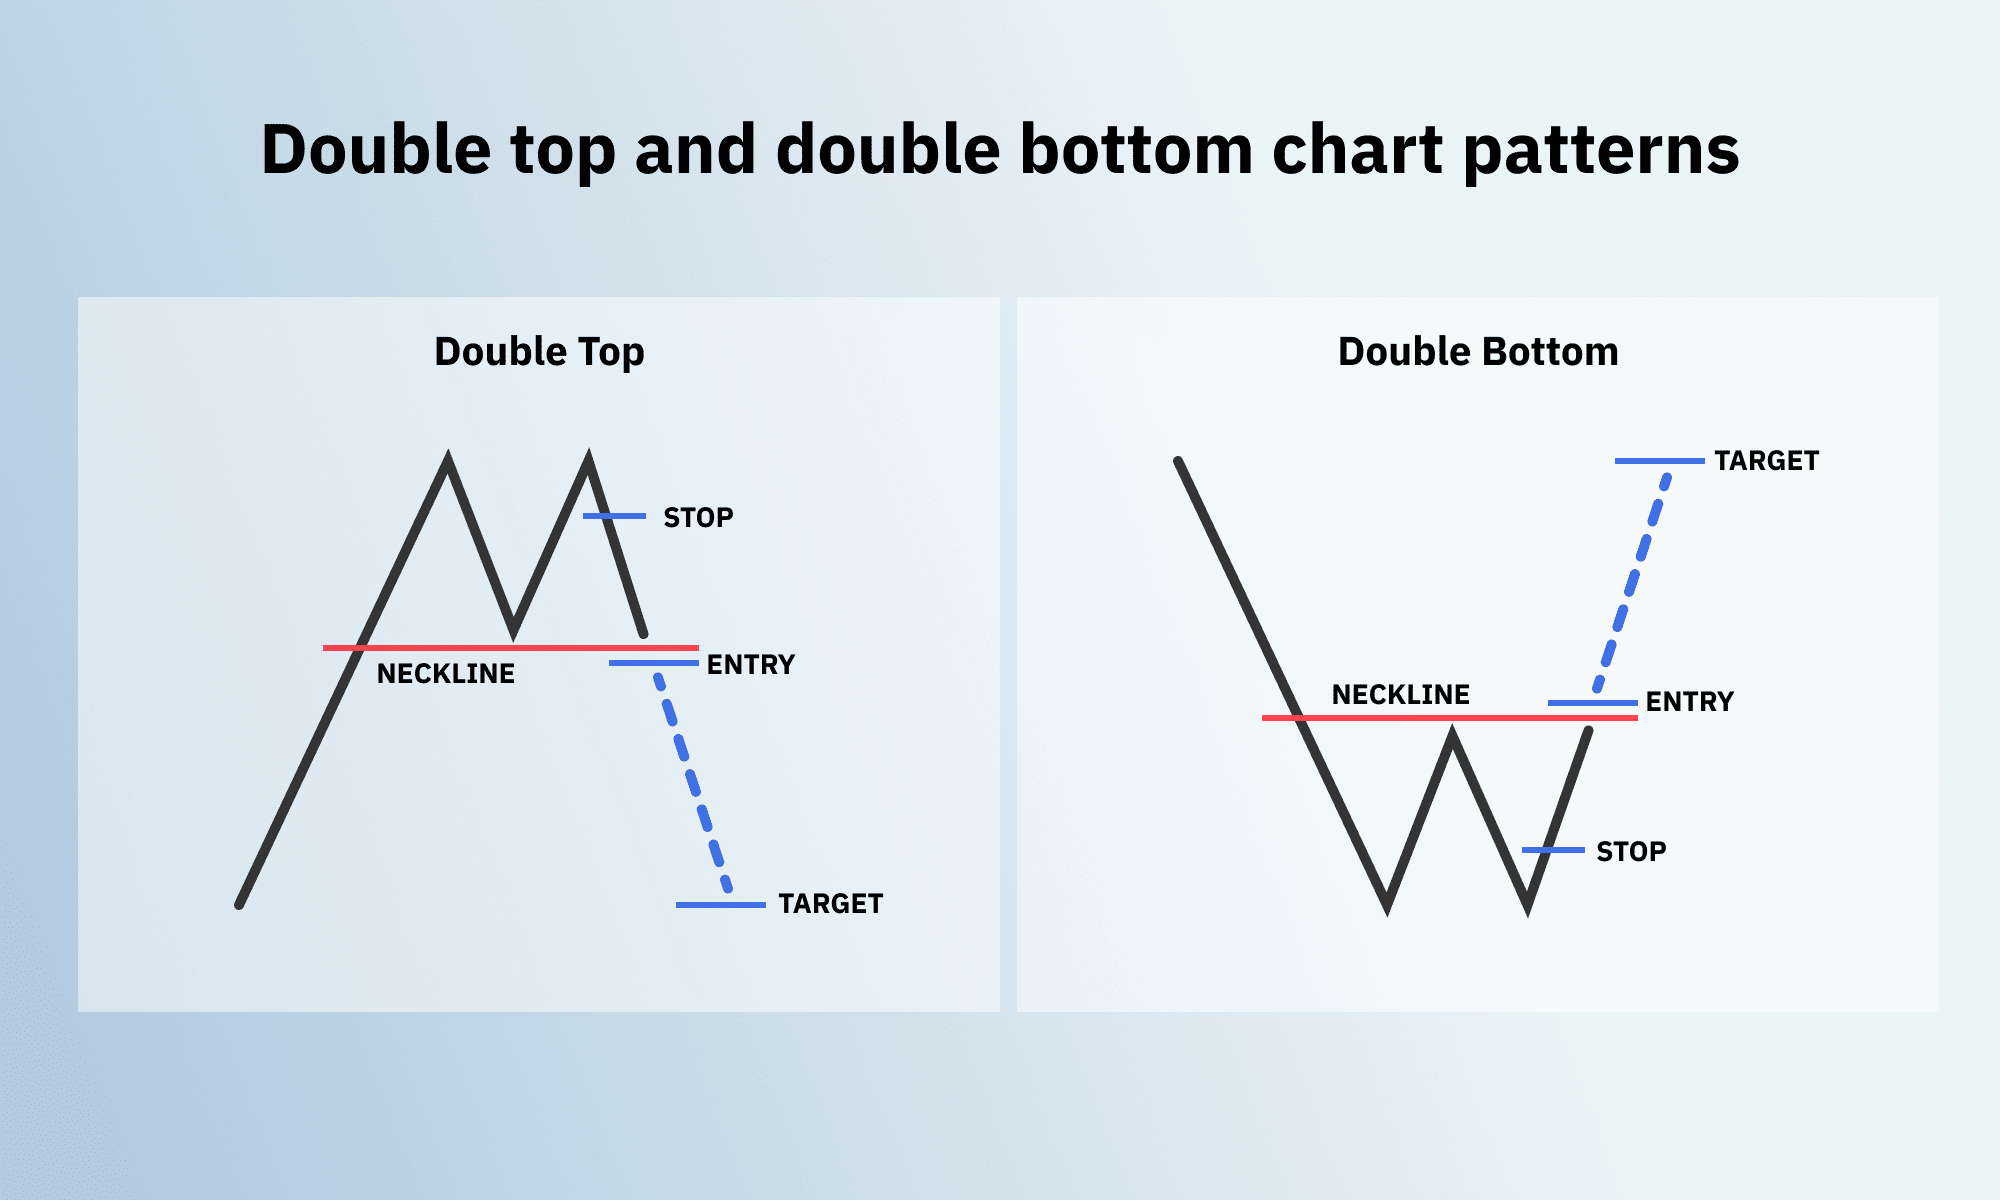
Double top and double bottom
These price patterns are made of 2 peaks or 2 drops, where the price bounces between support and resistance levels and then breaks out, moving in the opposite direction from the previous trend.
-
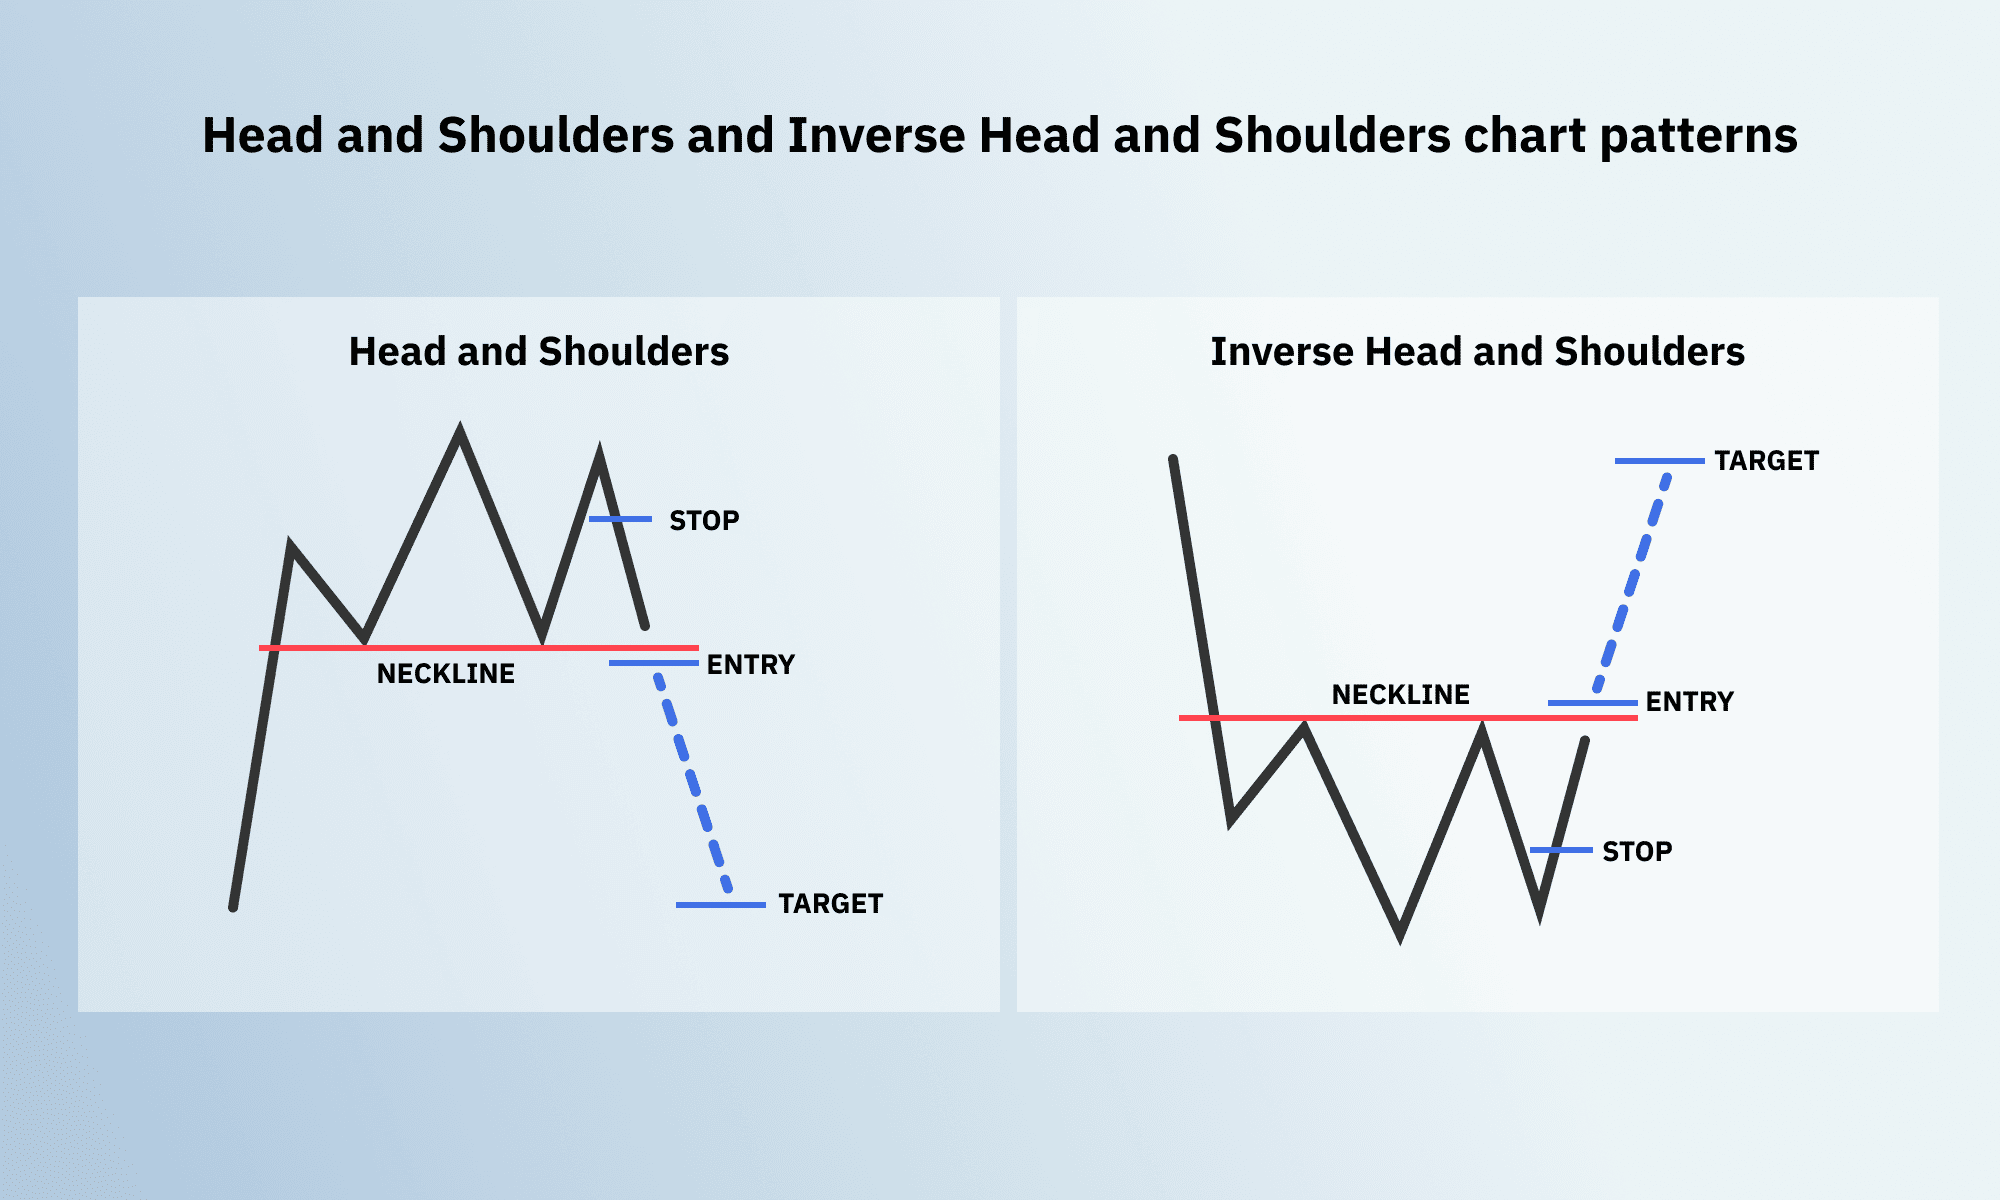
Head and shoulders and inverse head and shoulders
These 2 patterns are very similar to double top and double bottom but are made of 3 price peaks or drops, with the biggest one in the middle. After the third one, the price tends to break out and move in the opposite direction from the previous trend as well.
Continuation chart patterns
Continuation chart patterns tend to signal that the trend will resume its previous direction.
Here are some of the most common continuation chart patterns:
-
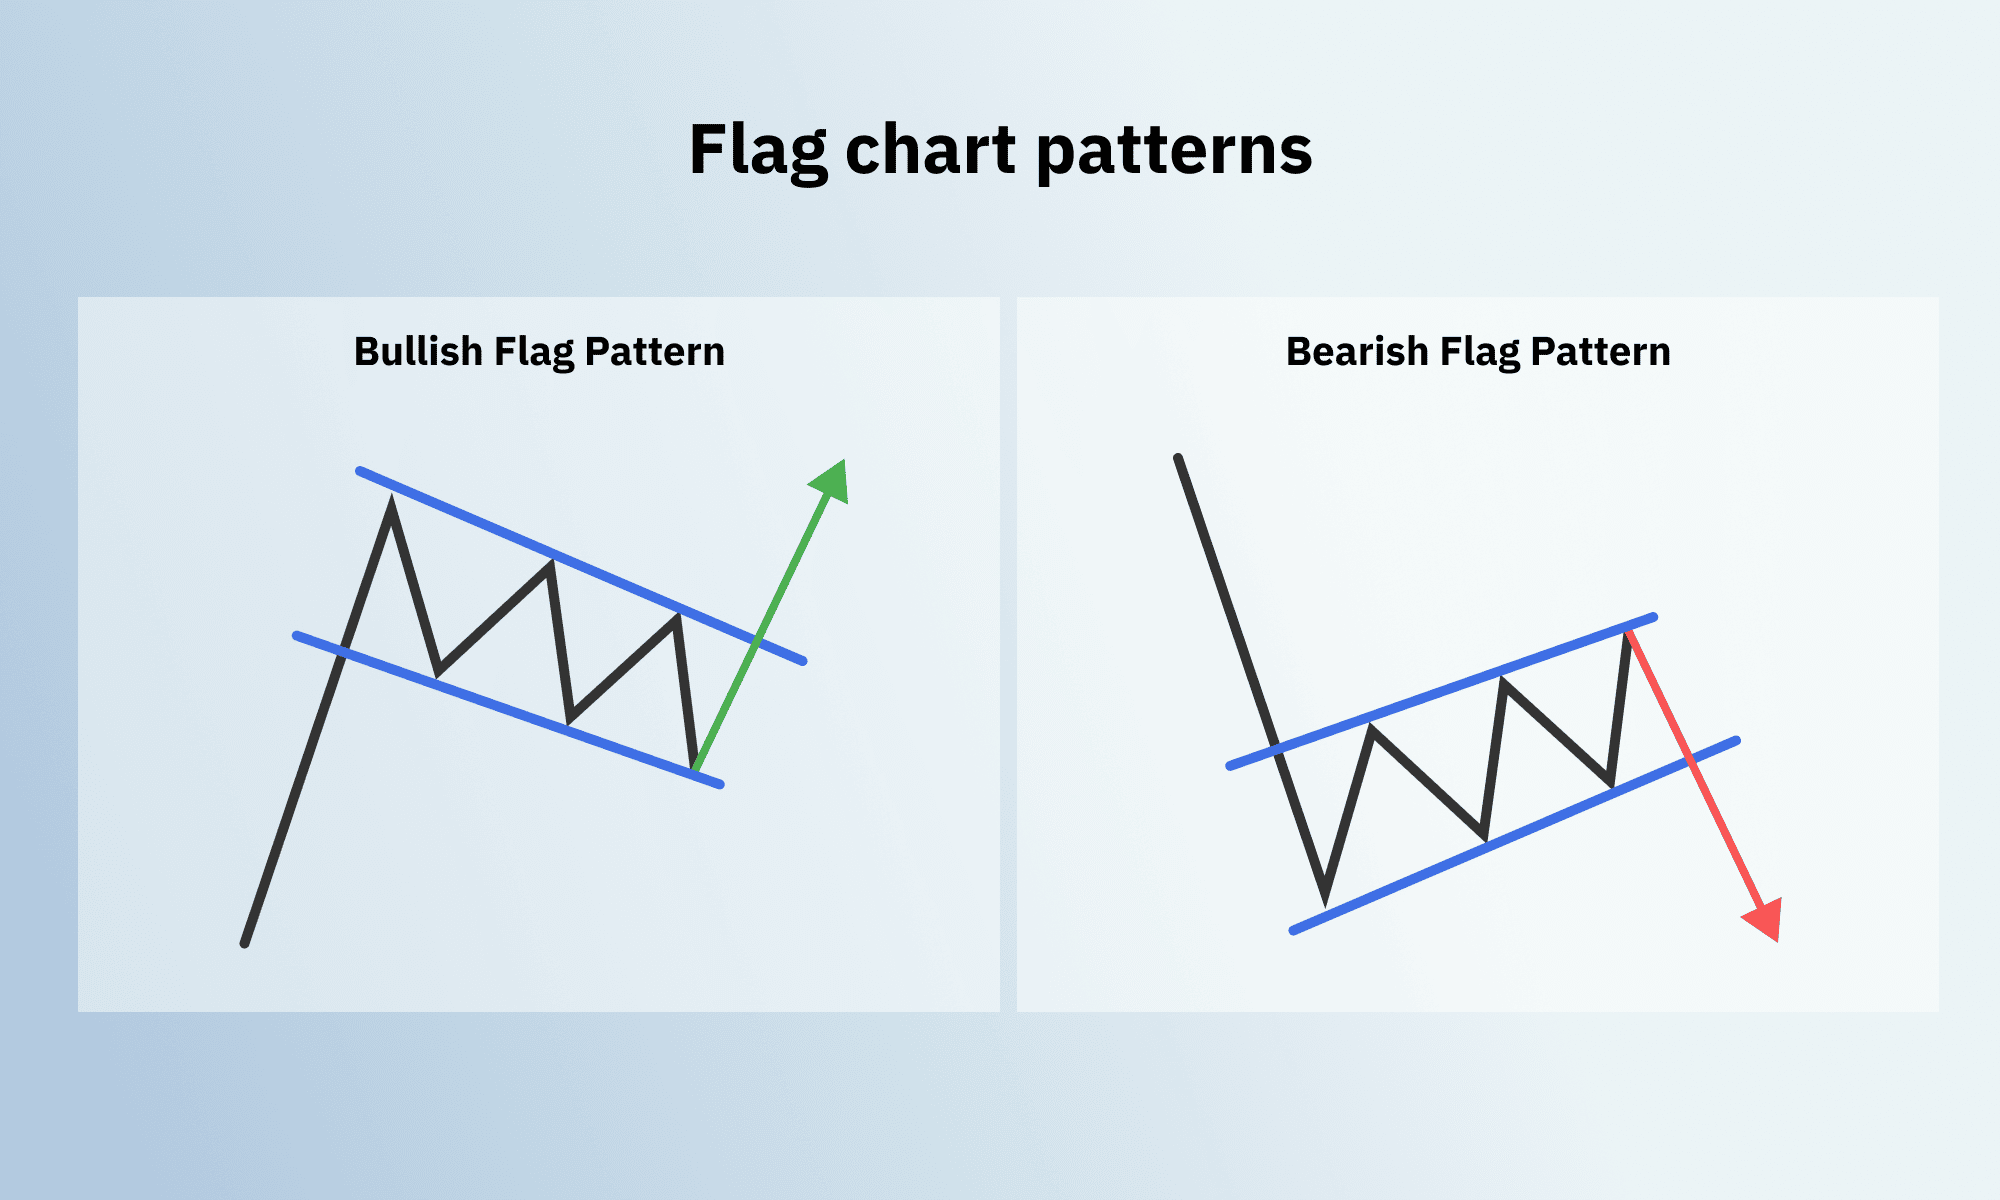
Flag
The flag chart pattern is made of a distinct flag ‘pole’, which indicates the previous trend, and 2 parallel lines – support and resistance, that suggest either rising (bullish) falling (bearish) upcoming price movement. Once the price breaks through one of the lines, it tends to follow the direction of the previous trend.
-
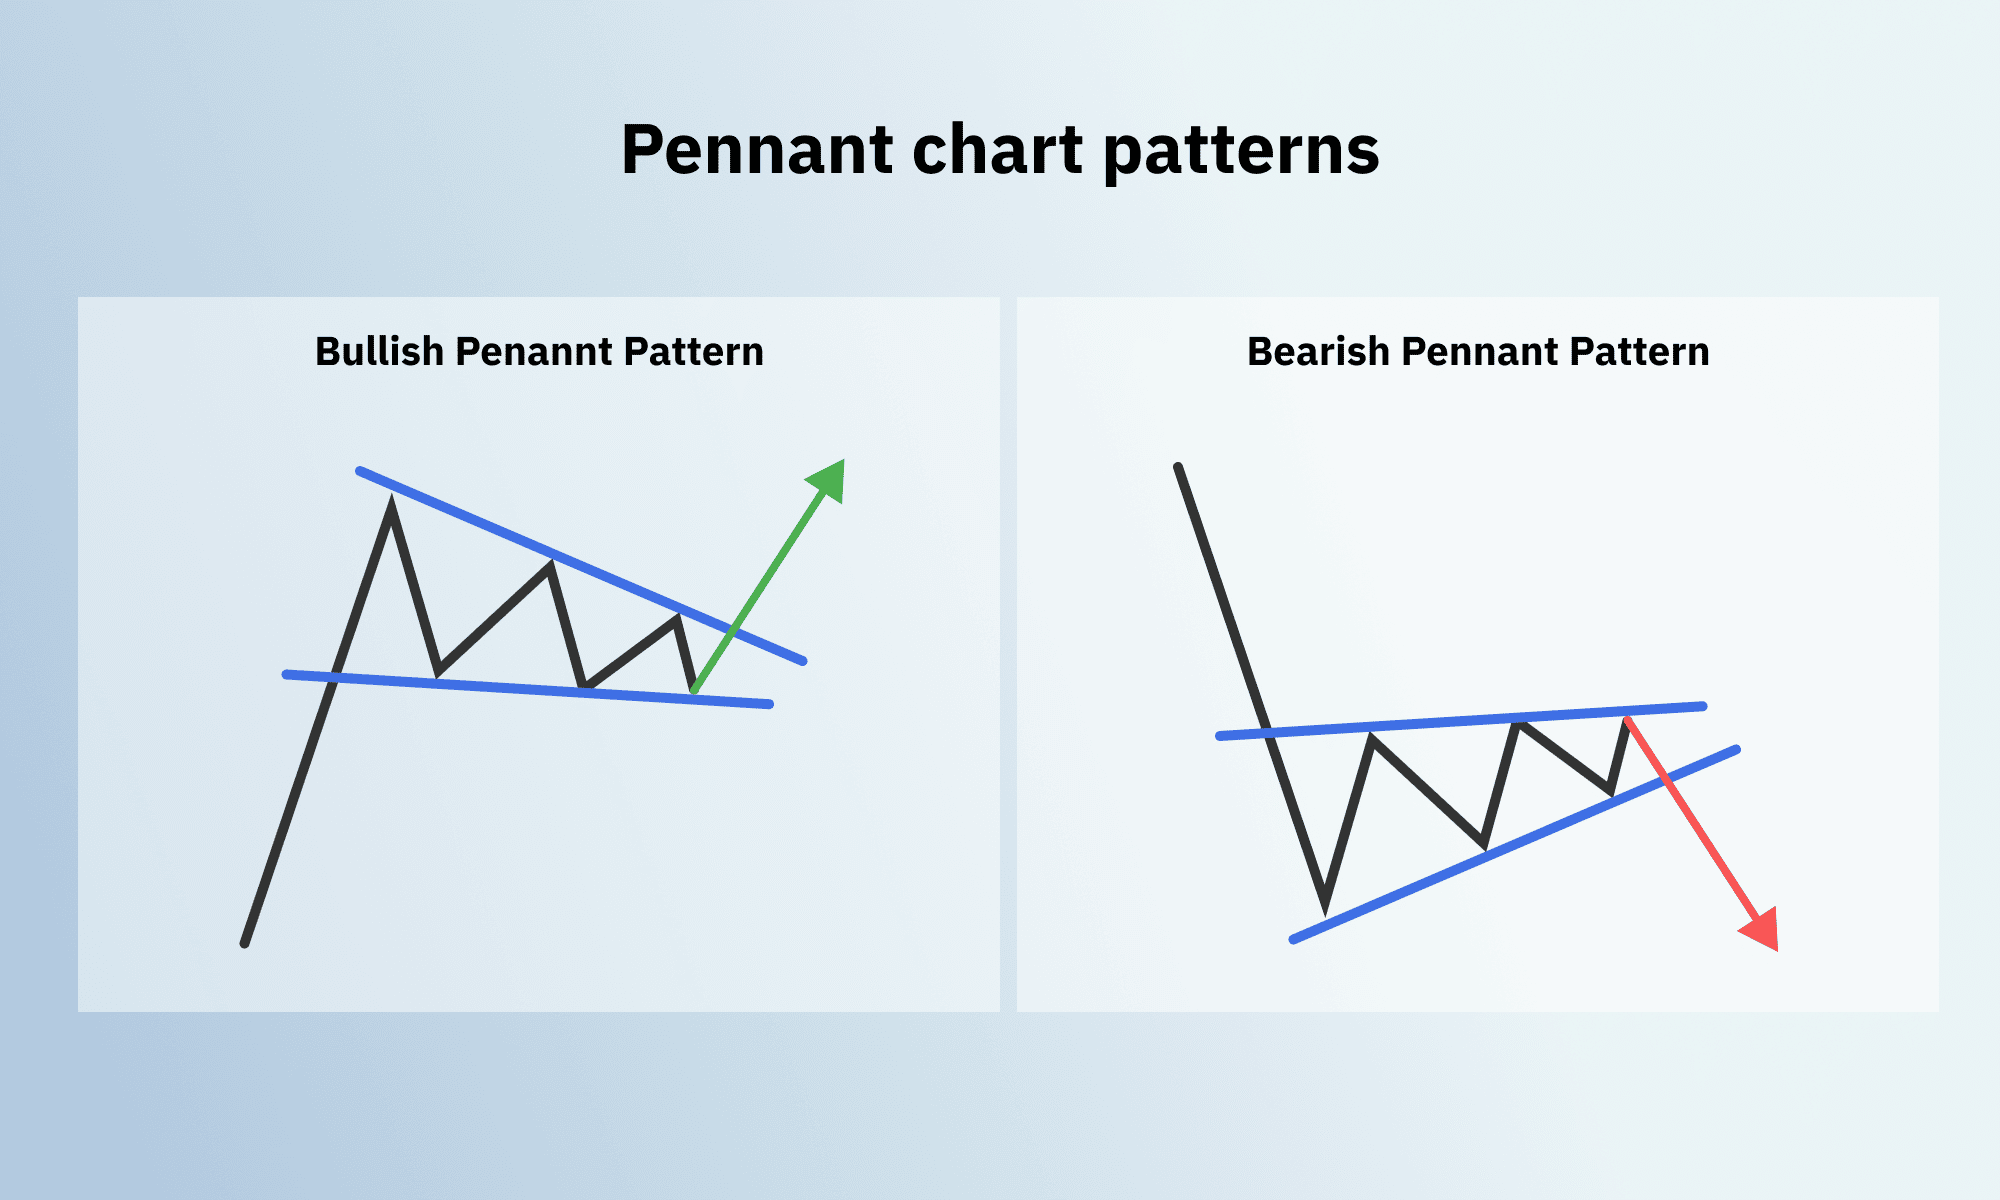
Pennant
The pennant chart pattern is very similar to the flag. It also has a well-defined ‘pole’, but its support and resistance trend lines meet in the middle horizontally. The price usually breaks out, following the direction of the previous trend.
-
Wedge
The wedge chart pattern is very similar to the pennant, but its support and resistance trend lines can be rising or falling instead of meeting strictly in the middle of the pattern and forming a horizontal shape. In either case, the price is highly likely to move in the same direction as a previous trend.
Bilateral chart patterns
The bilateral chart patterns give 50/50 chances of the trend reversing or continuing, which gives traders an excellent opportunity to place 2 trades simultaneously.
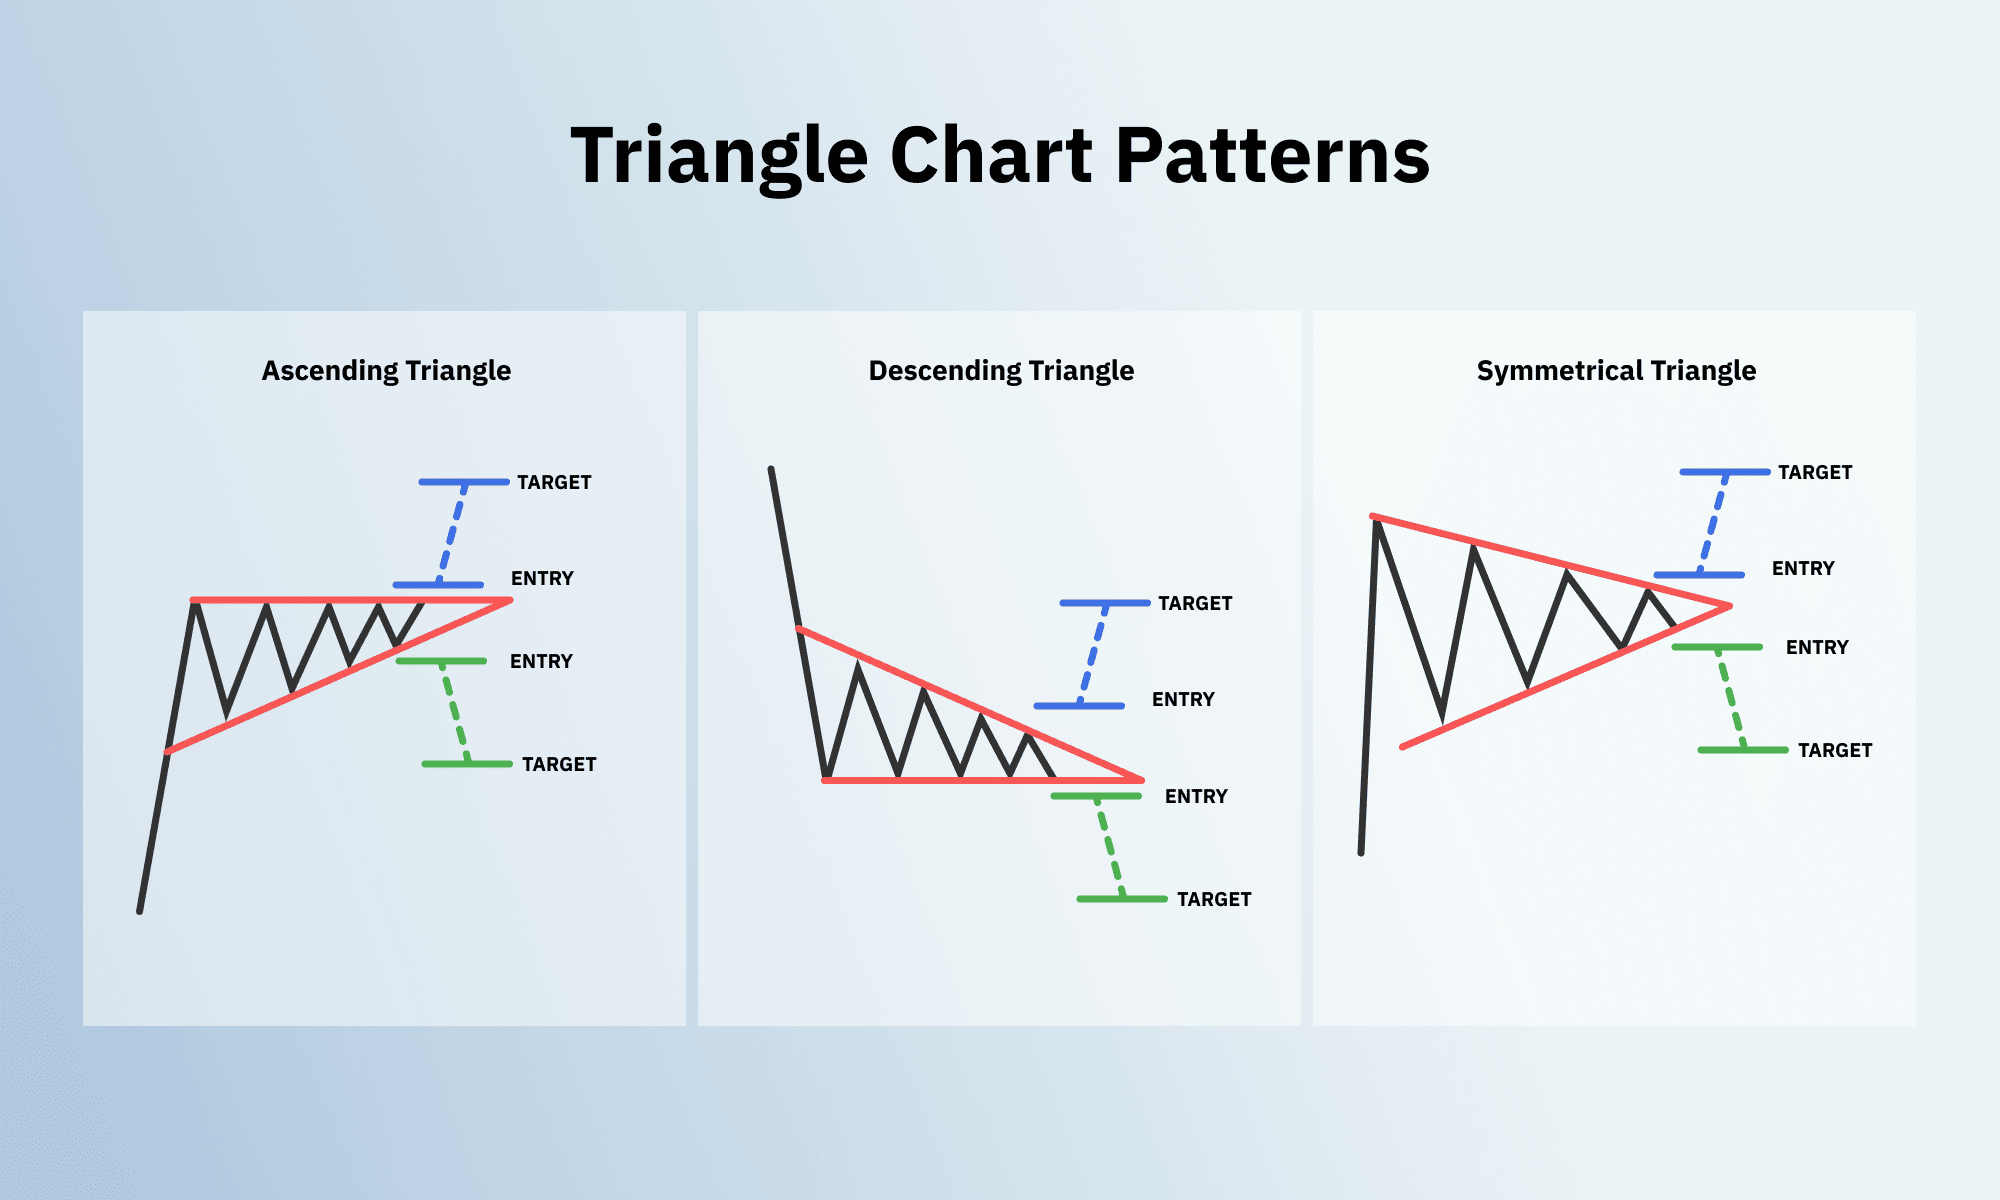
All 3 types of bilateral patterns resemble the previously described continuation patterns, with 3 significant differences:
- Ascending triangle has a strictly horizontal resistance trend line
- Descending triangle has a strictly horizontal support line
- Symmetrical triangle doesn’t have a distinct ‘pole’, unlike the flag pattern. The price preceding the symmetrical triangle shape is usually built up gradually.
How to improve your trading strategy using chart patterns?
Having a clear idea of how these basic chart patterns work will help you predict where the price is going to move next more accurately. Professional traders use a wide range of patterns, but the trading strategy is the same, whichever pattern you find in your price chart. As soon as the price breaks out of the resistance or support line, you place your buy or sell trade, based on the predicted direction.
However, it’s important to keep in mind that while these patterns can help indicate a market’s future price movement, they are still only predictions and don’t give you 100% accuracy. There is always a chance of a false breakout when the price breaks through the line and then returns shortly after without forming a new trend.
Consequently, you should carefully assess your risk and practise on a risk-free demo account before trading with real money. And if you want to take your technical analysis skills one step further, in our next blog post, we will walk you through the automatically calculated tools to help you refine your trading strategy.

