
The trading world at Deriv just got a whole lot more exciting! Say hello to Hybrid Indices-the latest evolution in synthetic trading. These bad boys take the best parts of our Crash/Boom Indices and mix them up with the dynamic energy of Volatility Indices. The result? A trading experience that’s more lifelike, more unpredictable, and packed with even more opportunities.
What are Hybrid Indices?
If you’ve traded Crash/Boom Indices before, you know how they work. Crash Indices climb steadily before dropping like a rock, while Boom Indices dip slightly before shooting up.
Hybrid Indices keep that basic structure but throw in a twist-extra volatility before the big move. This makes them behave even more like real-world markets, where things aren’t always so predictable. More movement, more excitement, and more chances to sharpen your trading game.
How do they compare?
Hybrid Indices have an annualised volatility of 20%, meaning they move a bit differently from traditional Crash/Boom Indices. They still deliver those signature dramatic price swings, but the lead-up is less predictable, keeping traders on their toes. It’s all about strategy and timing-so if you love a challenge, these are for you!

Vol over Boom 400

Vol over Boom 550

Vol over Boom 750
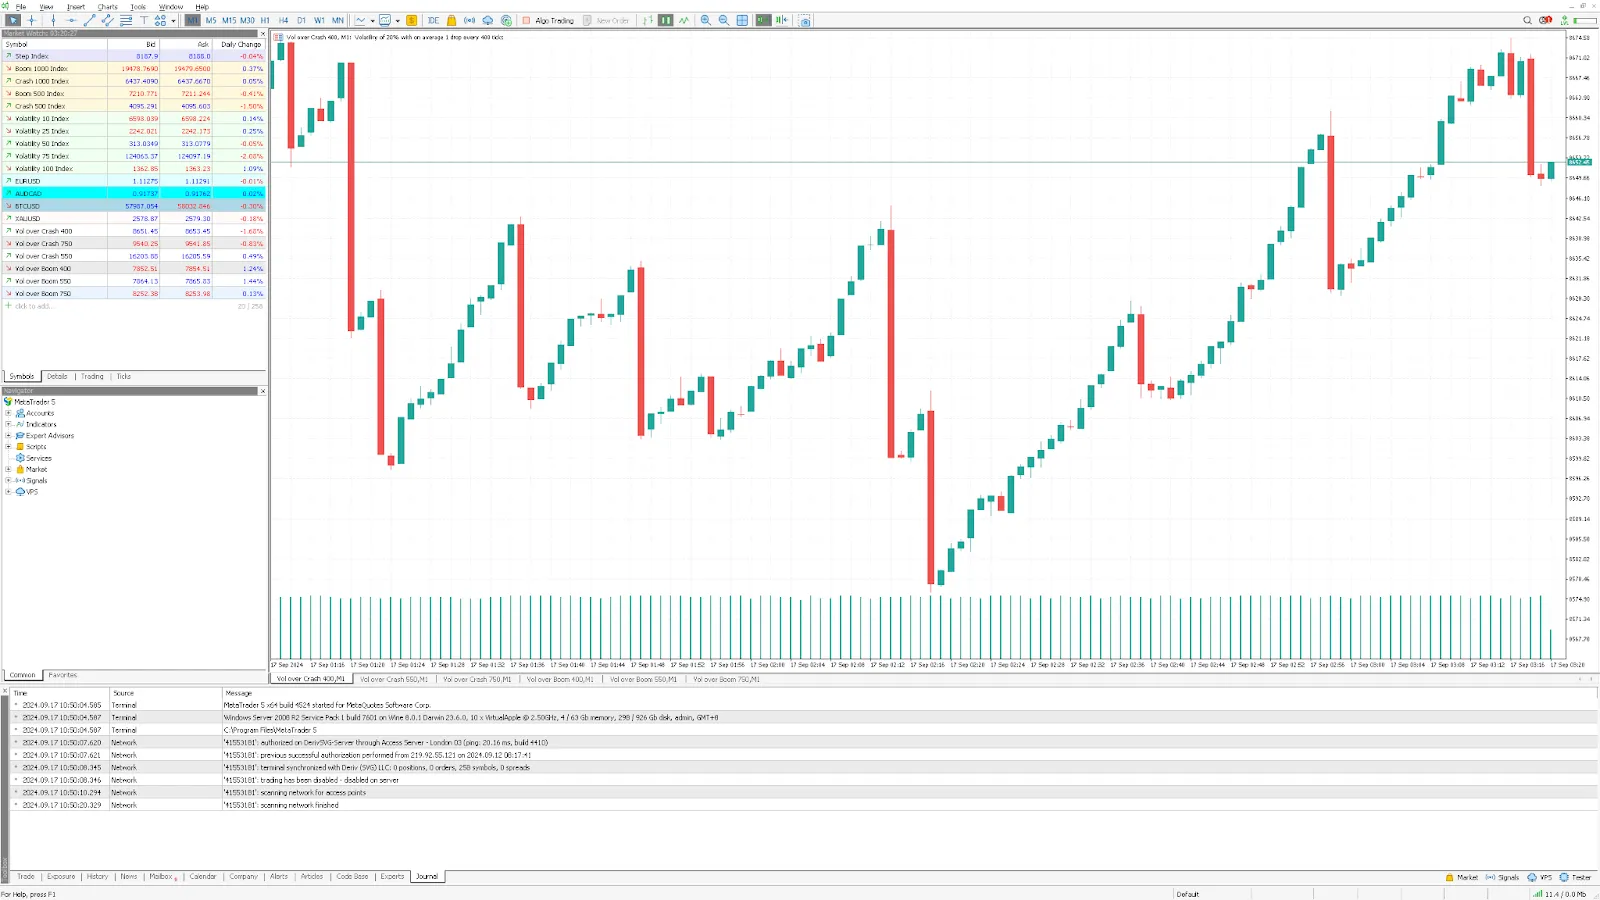
Vol over Crash 400

Vol over Crash 550

Vol over Crash 750
Lower synthetic volatility through Hybrid Indices trading
It is important to note that the Hybrid Indices generally exhibit a lower annualised volatility than the Crash/Boom Indices. This is illustrated in the volatility comparison plot below.

Start trading Hybrid Indices today
Hybrid Indices are here to push the boundaries of synthetic trading, blending the old with the new to create a more realistic and potentially profitable trading environment. Open your free practice trading account and explore the Hybrid Indices on Deriv MT5 and cTrader, or learn more about how to trade Synthetics Indices with our free courses on Deriv Academy.
Ready to give them a go?
If you’re up for a fresh trading challenge, Hybrid Indices are waiting! Open a free practice account on Deriv MT5 or cTrader and see how they fit into your strategy. Need a little guidance? Check out Deriv Academy for free courses on Synthetic Indices.
This is your chance to trade with an extra dose of realism—are you in?
Quiz
What makes Hybrid Indices different from Crash/Boom Indices?
FAQs


Trade with confidence


