
Technical analysis is a process of analysing past data of financial markets, such as price and trading volume, to predict future price movements. While on other platforms, you analyse price chart patterns or apply technical indicators and execute trades manually, with Deriv Bot, these processes are automated with pre-set blocks.
If you are not familiar with the concept of technical analysis, we’ve covered it extensively in our What is technical analysis in trading blog. Let’s go through the details of how it works on Deriv Bot.
Ticks and candles analysis
The simplest way of using technical analysis on Deriv Bot is to use the ‘Tick and candle analysis’ blocks, which can be found under their respective subtab in the ‘Analysis’ tab.
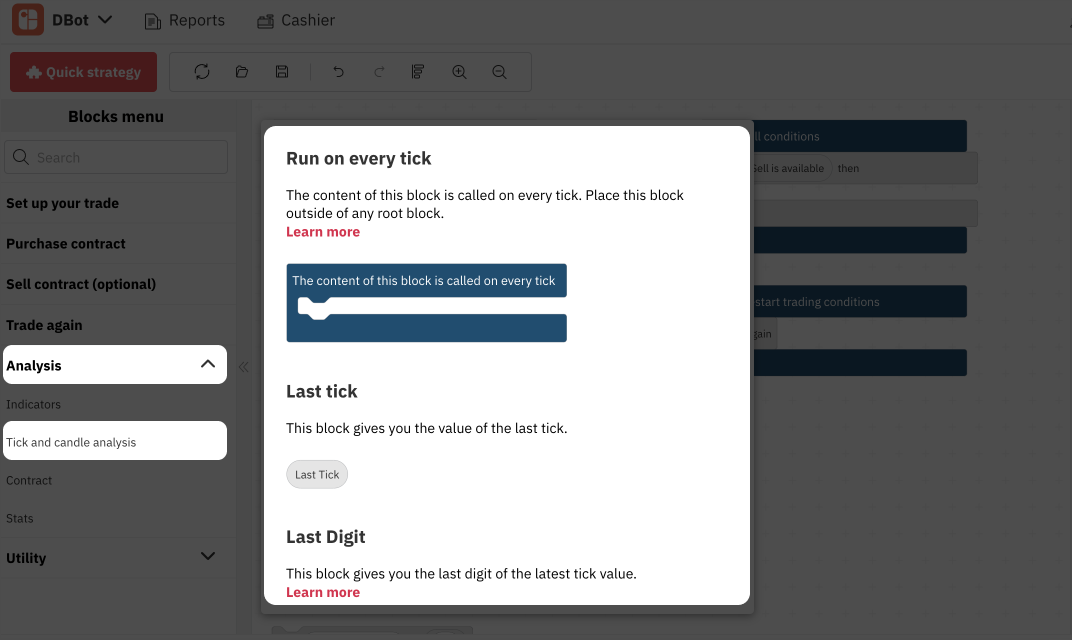
These blocks analyse the prices of the previous ticks, candles, or the entire market direction. You can find a more detailed description of the functionality of each block by clicking the ‘Learn more’ next to them.
Here is a simple example of how to set up a basic options trading strategy that will purchase a contract based on the last digit of the previous tick:
- Select the ‘Conditional block‘ and drag it to your mandatory ‘Purchase block’. It is located under the ‘Utility’ subtab ‘Logic’
- Select the ‘Compare block’ and drag it into the empty placeholder of your ‘Conditional’ block. It is under the same subtab.
- Select the ‘Last digit’ block from the ‘Tick and candle analysis’ subtab of the ‘Analysis tab’, and drag it into the first placeholder of your ‘Compare’ block.
- Select the ‘Number block’, drag it into the second placeholder of your ‘Compare’ block, and select the rule (equal, or not equal to, or greater, etc.). It is located under the ‘Utility’ subtab ‘Math’.
- Select the type of contract for your trade – rise or fall in our example.
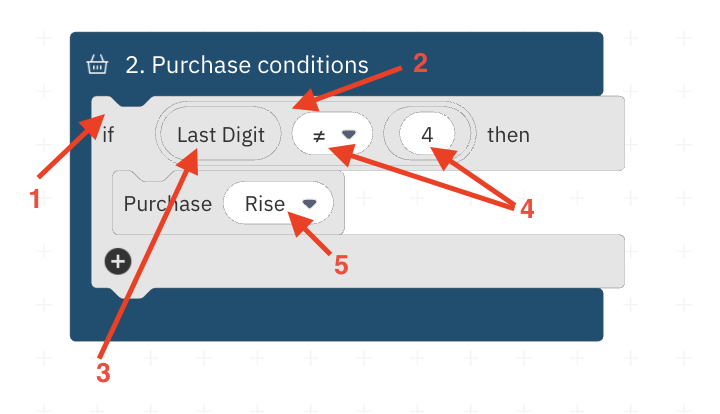
Once you complete all these steps, your ‘Purchase conditions’ block is ready. The conditions we’ve just set will instruct your trading bot to buy a Rise contract whenever the last digit of the previous tick is not equal to 4.
This particular strategy is only an example of how you can use the Tick and candle analysis blocks and doesn’t carry any value in a proper trading environment.
Technical indicators in Deriv Bot
Another way of using technical analysis with your trading bot is to apply technical indicator blocks that can be found in the ‘Indicators’ subtab of the ‘Analysis’ tab.
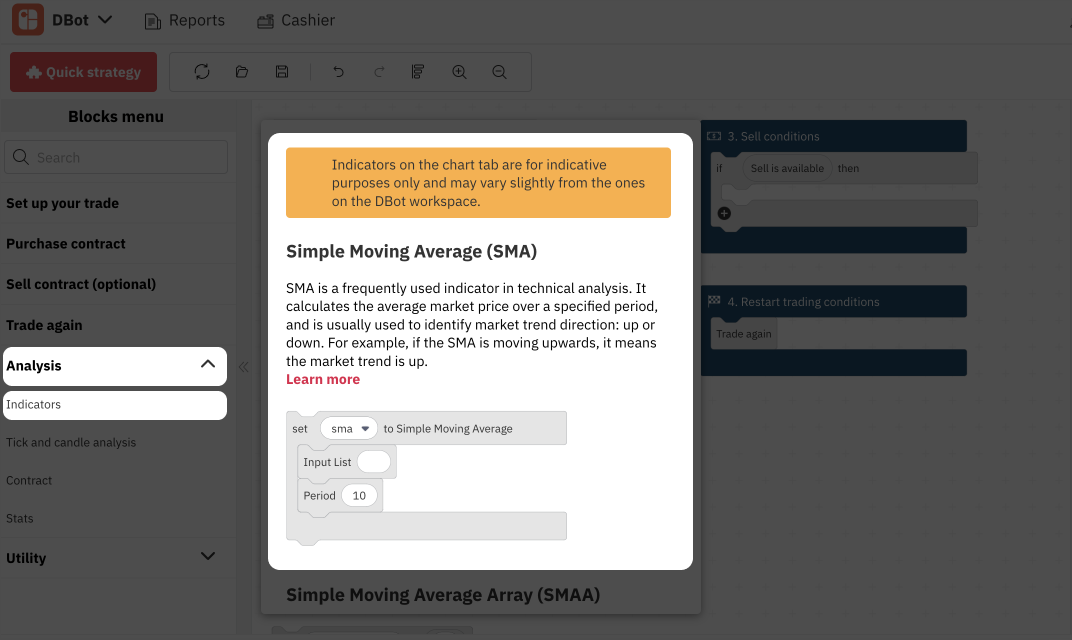
Deriv Bot has 5 main Indicator blocks to help you evaluate all the main signals that can predict future price movements:
- Simple Moving Average (SMA)
- Simple Moving Average Array (SMAA)
- Bollinger Bands (BB)
- Bollinger Bands Array (BBA)
- Exponential Moving Average (EMA)
- Exponential Moving Average Array (EMAA)
- Relative Strength Index (RSI)
- Relative Strength Index Array (RSIA)
- Moving Average Convergence Divergence (MACD)
The difference between a normal indicator and an indicator with an array is that a normal indicator shows only the latest calculation, whereas an indicator with an array shows the list of past calculations. An indicator with an array is catered for a complex strategy where you need to find the change in the calculation. In this example, we would be using Bollinger Bands (BB).
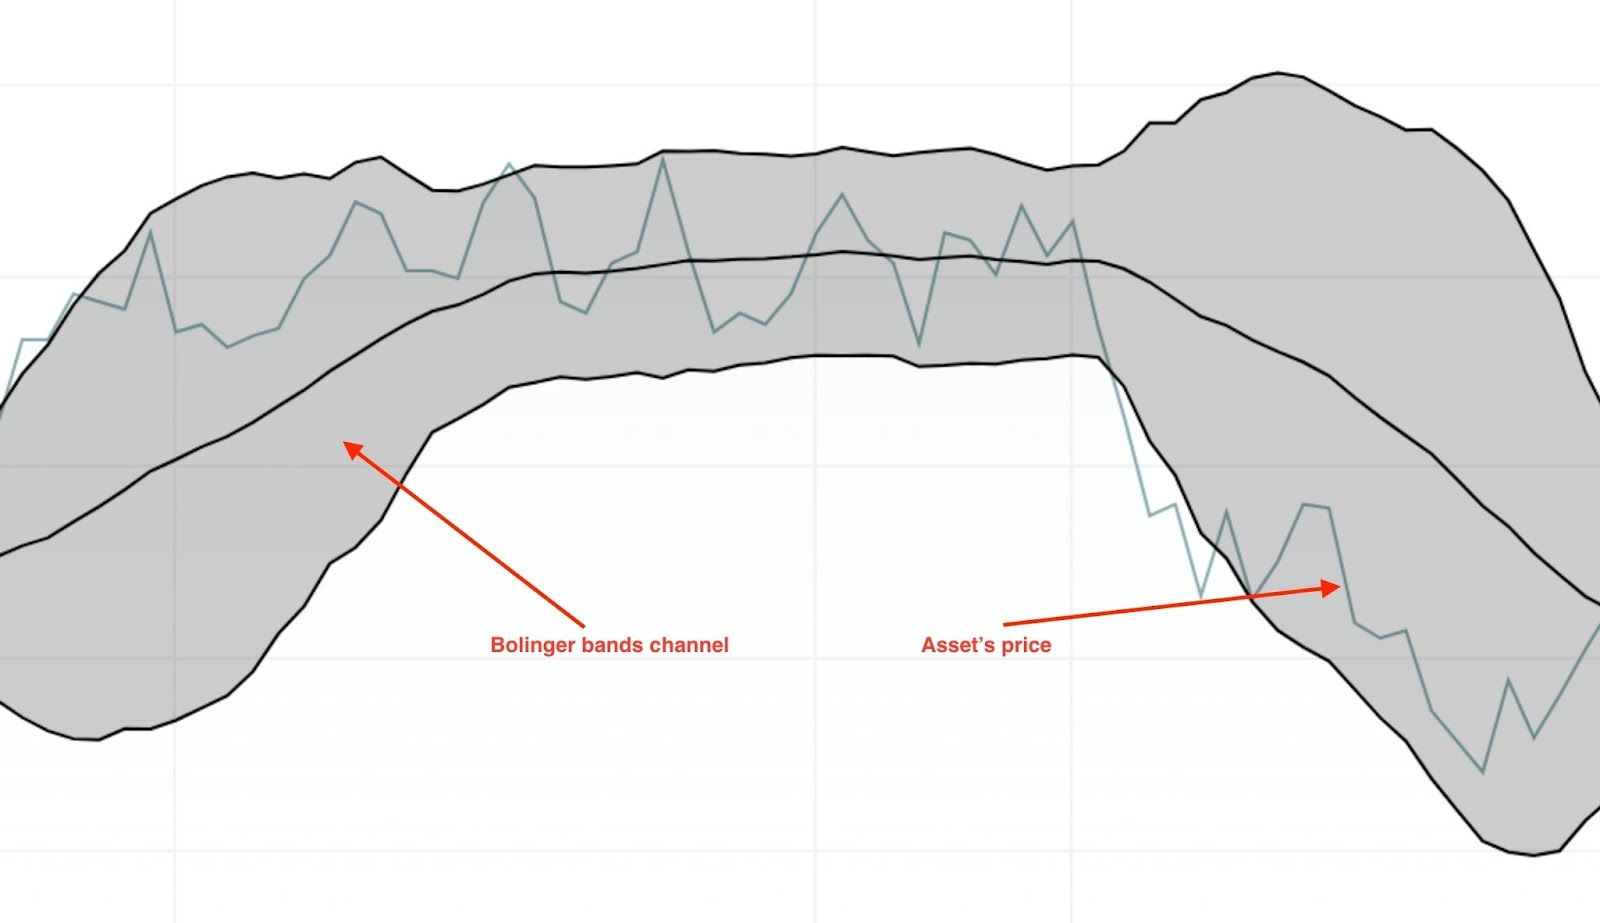
In a price chart, the Bollinger Bands indicator looks like a channel made of 3 lines. The middle line is the mean of the price, which is similar to the Simple Moving Average. The upper and lower bands are the standard deviation of the price. The simple rule is that whenever the price breaks out of one of the outer lines, it tends to move back to the middle line, serving as a signal for traders.
With Deriv Bot, you don’t need to monitor the price chart to catch the moment when the breakout happens – you can just instruct your bot to do it and buy a contract when it happens. Let’s demonstrate how to create the lower band of Bollinger Bands.
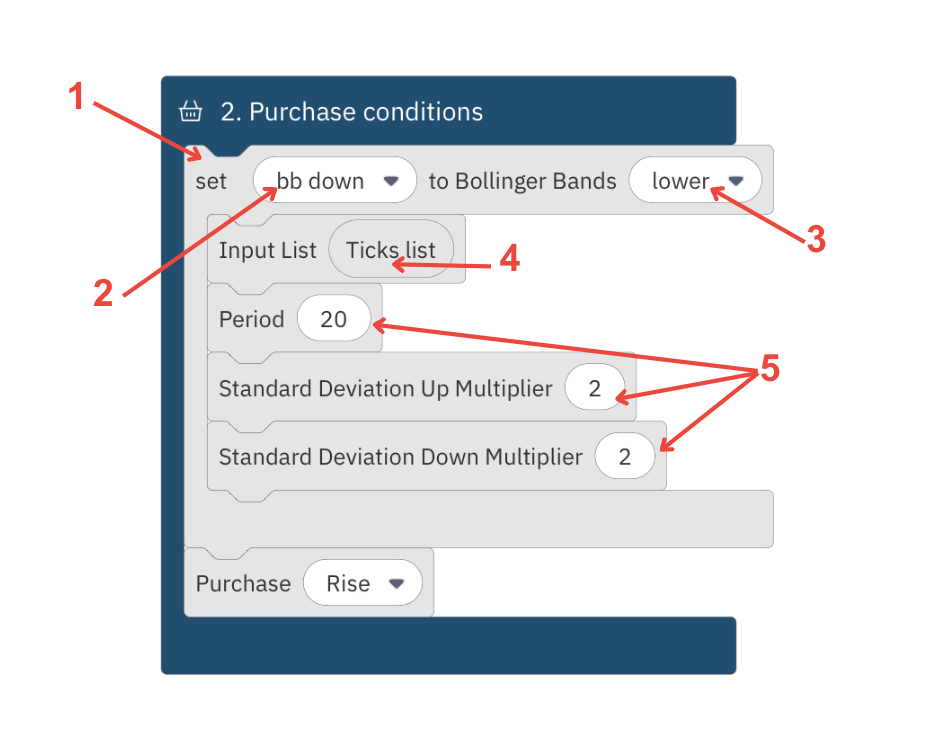
1. Select the ‘Bollinger Bands’ block from the list of indicators and drag it to your ‘Purchase conditions’ block.
2. Click the ‘bb’ variable, select the ‘Rename variable’ option from the dropdown, and assign the ‘bb down’ name to it.
3. Click the ‘middle’ variable and select the ‘lower’ value from the dropdown.
4. Select the ‘Tick list’ block from ‘Tick and candle analysis’ and insert it in the placeholder next to the Input list.
5. The ‘Period’ block shows the number of past ticks the indicator will use to analyse the market trend, while the ‘Standard Deviation Up/Down Multiplier blocks show how wide the outer lines of the indicator are. For this example, let’s set it to 20, 2 and 2, respectively.
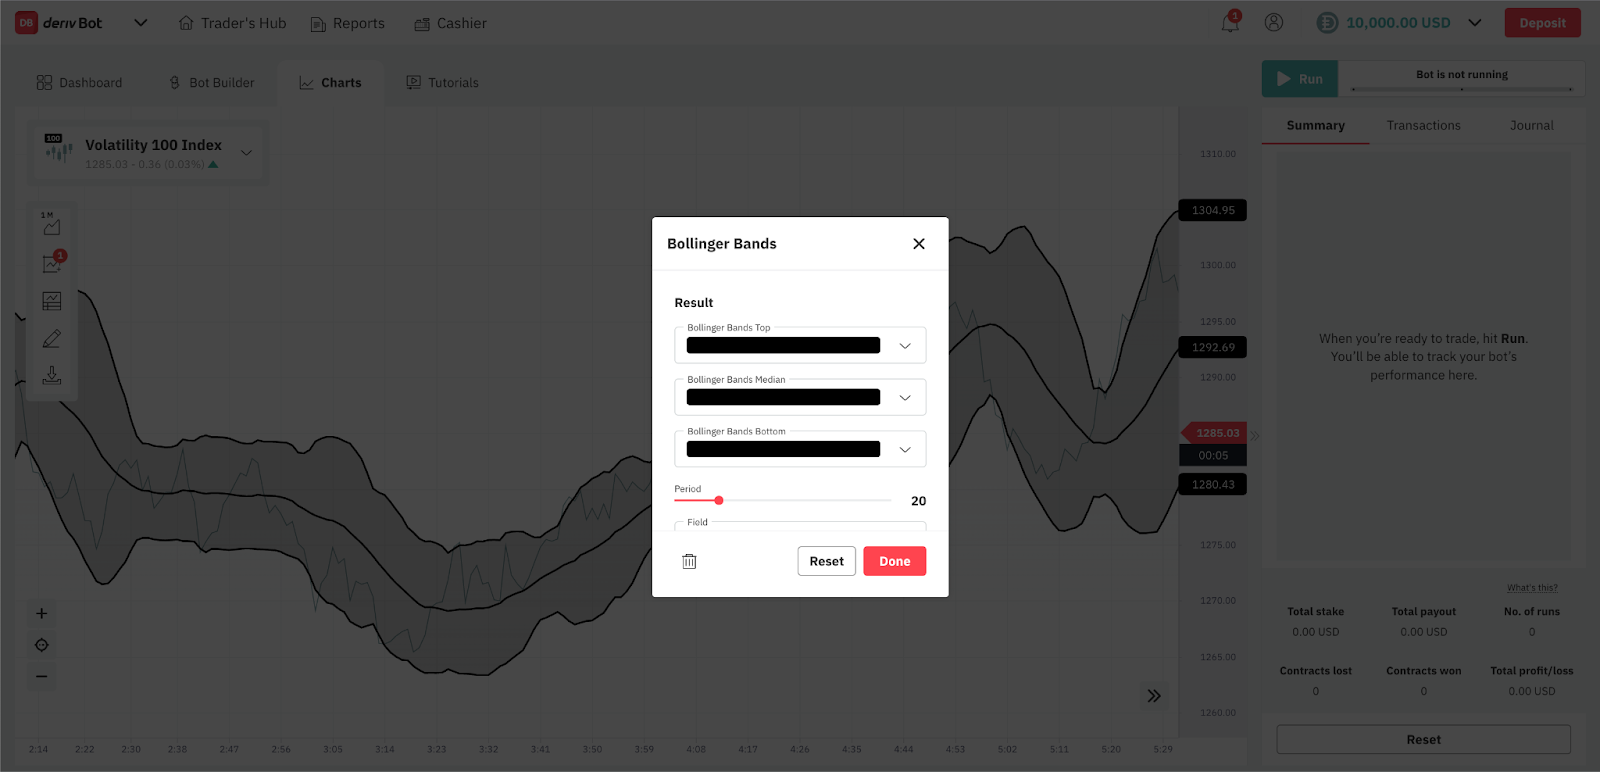
To understand how the strategy is reflected visually, you can go to the ‘Charts’ tab at the top left corner of your workspace and apply the Bollinger bands indicator in the price chart. To add the indicator, you can do so by clicking on ‘Indicators’ on the left toolbar, clicking on the ‘Volatility’ tab and selecting ‘Bollinger Bands’. To change the settings, on the same page, click on the ‘Active’ tab and click on the settings icon. Alternatively, you can exit the page from the price chart, right-click on any of the bands change the numbers in the window that pops up and click ‘Done’.
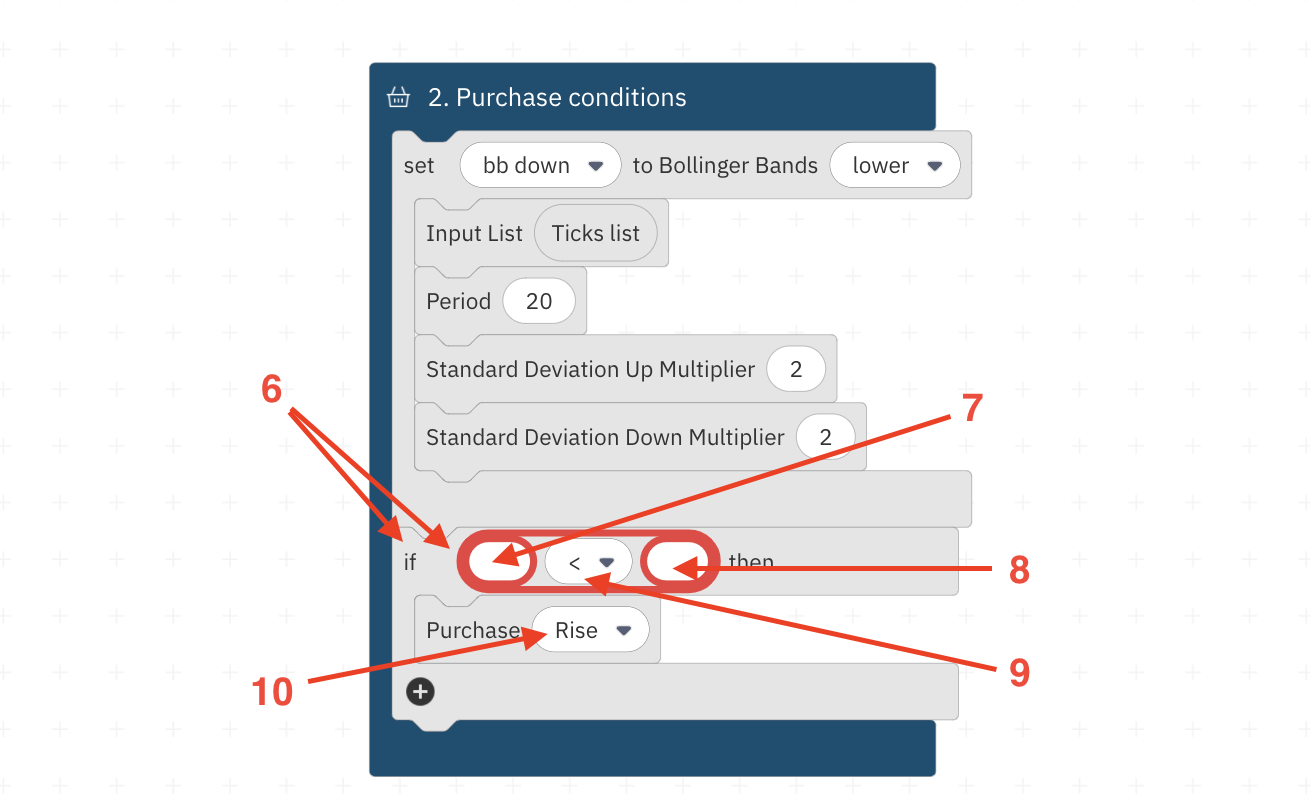
6. Select the ‘Conditional block’ and place it right below Bollinger Bands, and place the ‘Purchase (Rise)’ block inside the ‘Conditional block’ and add the ‘Compare’ block to it, just like we did when we set up a trading strategy based on the last digit in the previous example.
7. Select the ‘Last tick’ block from ‘Tick and candle analysis’ and drag it into the first placeholder of your ‘Compare’ block.
8. Go to your ‘Variables’ subtab and select the ‘bb down’ variable we created earlier, placing it into the second placeholder of your ‘Compare’ block.
9. Set the rule to the Last tick is less than the ‘bb down’ so that your bot takes action when the previous tick is below the lower Bollinger band.
10. Set the ‘Purchase’ block to ‘Rise’.
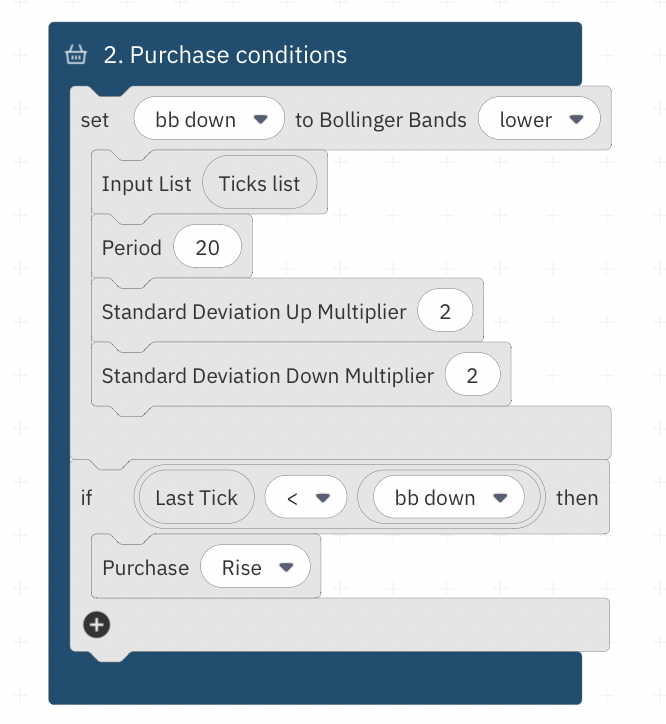
This strategy tells your trading bot to buy a Rise contract whenever a previous tick is lower than the bottom line of the Bollinger bands indicator.
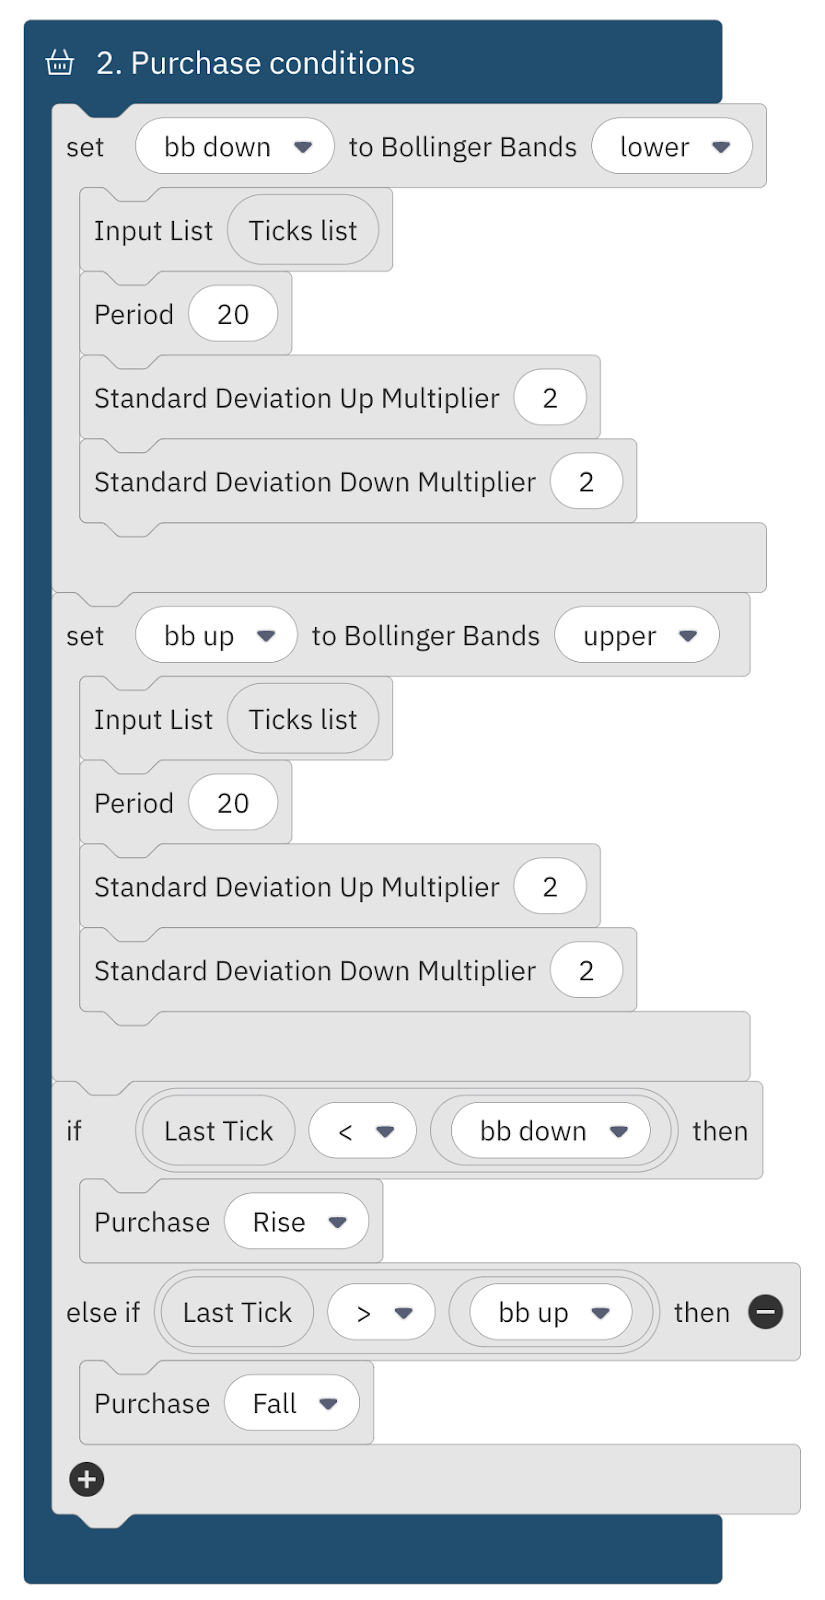
Here is how it will look like in your Deriv Bot platform:
Taking this strategy as an example, you can add one more ‘Bollinger bands’ block, replicating the same actions but for the upper line of the indicator. Below is an example.
Following the same methods, you can use other technical indicators on Deriv Bot to help your trading bot determine the best time to purchase a contract.
This sums up a complete overview of setting up a trading strategy with Deriv Bot – from setting up basic and advanced parameters to teaching your bot how to analyse markets.
Now you can test your newly acquired knowledge on your risk-free demo account, preloaded with 10,000 USD of virtual currency, or check our bonus Top 5 tips and tricks for your Deriv Bot trading strategy blog to find out a few more little hacks to make your Deriv Bot journey better.
Disclaimer:
The information contained within this blog article is for educational purposes only and is not intended as financial or investment advice.
Trading conditions, products, and platforms may differ depending on your country of residence.
Deriv Bot is unavailable to clients residing within the European Union.